 3
3peptides
spectra
0.000 | 0.000
0.000 | 0.000
0.000 | 0.097
0.000 | 0.189
0.000 | 0.000
0.212 | 0.438
0.188 | 0.258
0.267 | 0.344
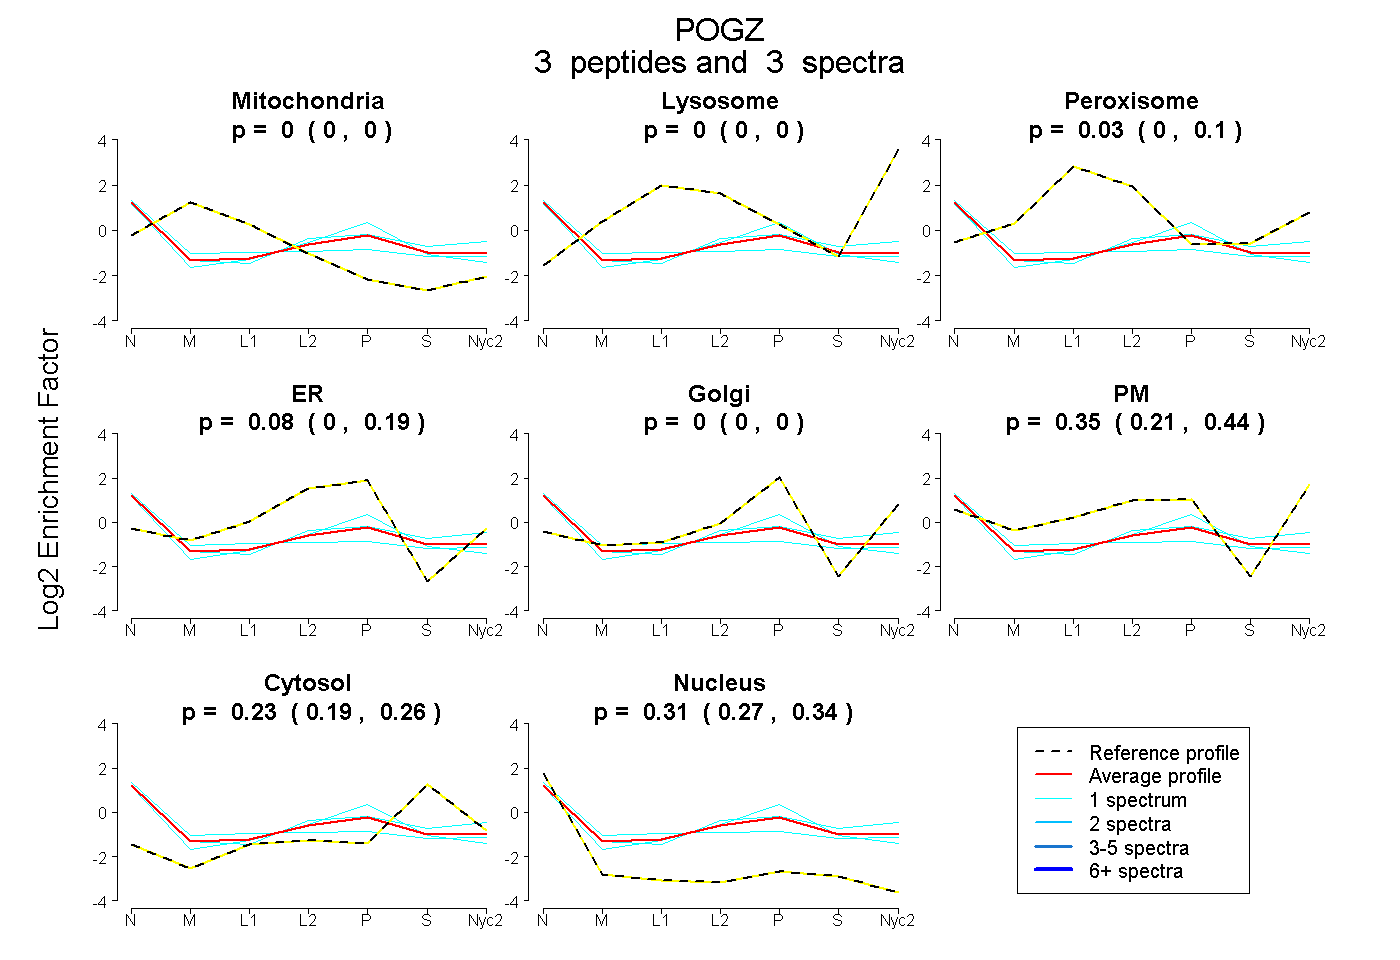
| Plot | Mito | Lyso | Perox | ER | Golgi | PM | Cytosol | Nucleus | |||||
| Expt A |
3 peptides |
3 spectra |
|
0.000 0.000 | 0.000 |
0.000 0.000 | 0.000 |
0.031 0.000 | 0.097 |
0.082 0.000 | 0.189 |
0.000 0.000 | 0.000 |
0.349 0.212 | 0.438 |
0.230 0.188 | 0.258 |
0.307 0.267 | 0.344 |
| 1 spectrum, HTACQHSK | 0.000 | 0.000 | 0.000 | 0.000 | 0.000 | 0.470 | 0.299 | 0.231 | ||
| 1 spectrum, LGQTPER | 0.000 | 0.000 | 0.196 | 0.000 | 0.000 | 0.267 | 0.124 | 0.413 | ||
| 1 spectrum, YSTCCSR | 0.000 | 0.000 | 0.000 | 0.355 | 0.000 | 0.128 | 0.218 | 0.299 |