 20
20peptides
spectra

0.000 | 0.000
0.000 | 0.000
0.000 | 0.000
0.253 | 0.322
0.027 | 0.100
0.000 | 0.013
0.012 | 0.038
0.603 | 0.623
1peptide
spectra
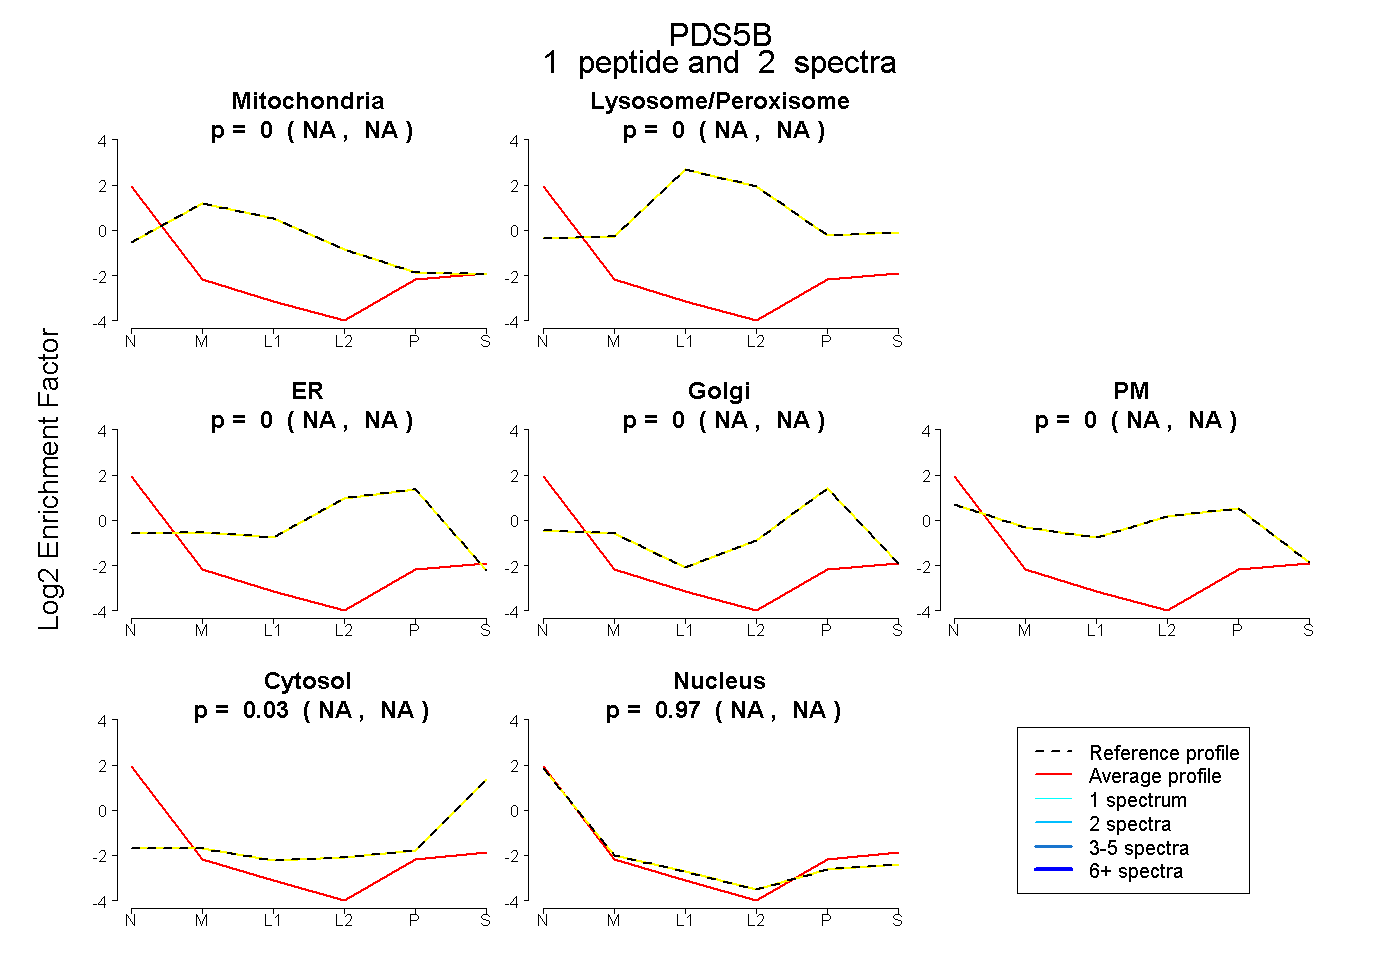
NA | NA
NA | NA
NA | NA
NA | NA
NA | NA
NA | NA
NA | NA
3peptides
spectra
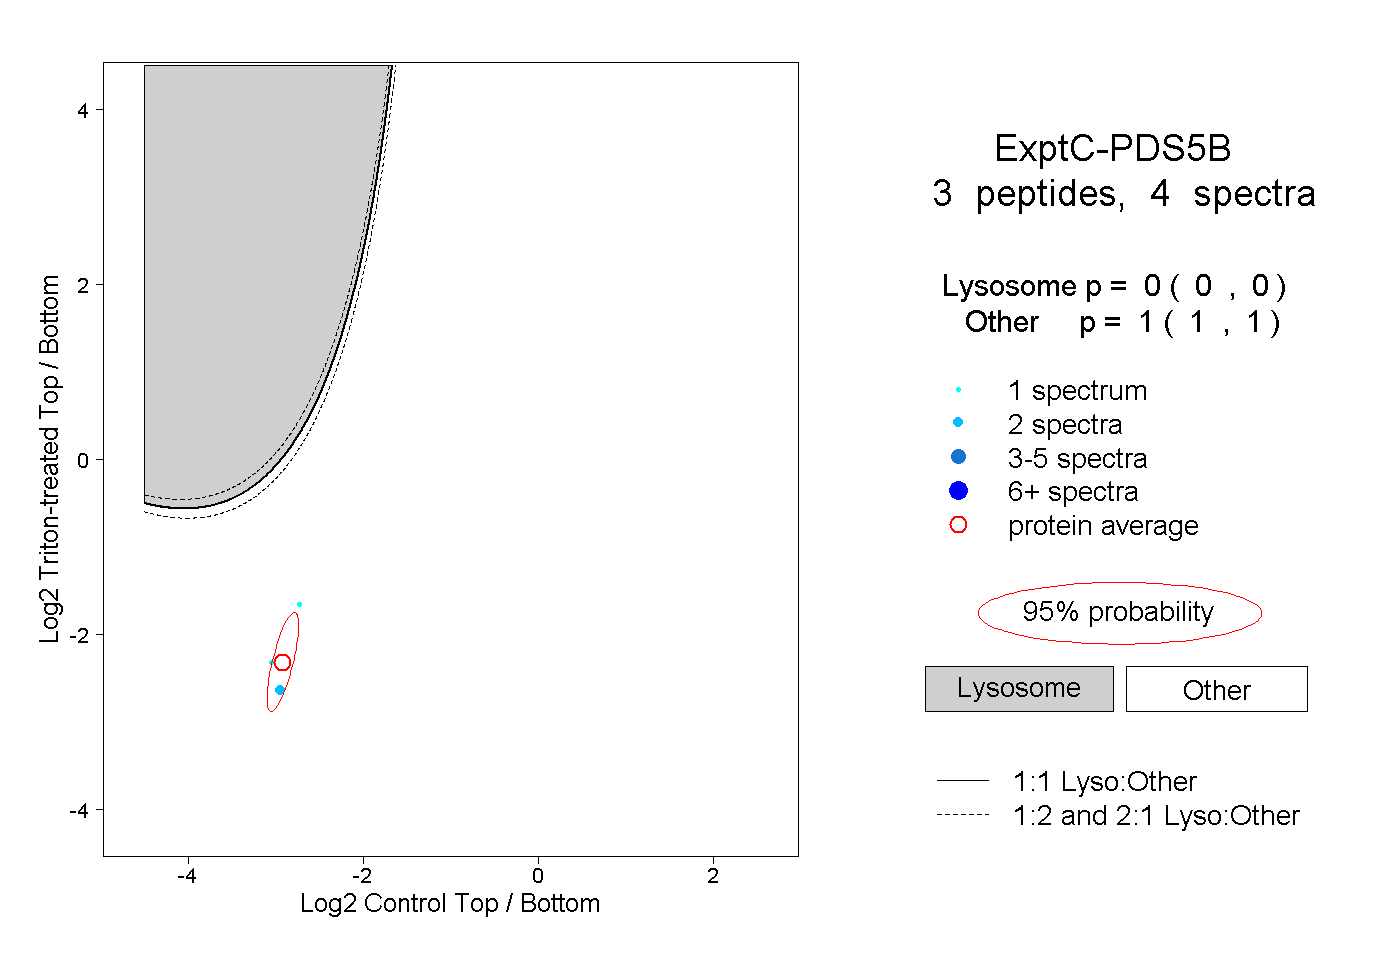
0.000 | 0.000
1.000 | 1.000