 2
2peptides
spectra
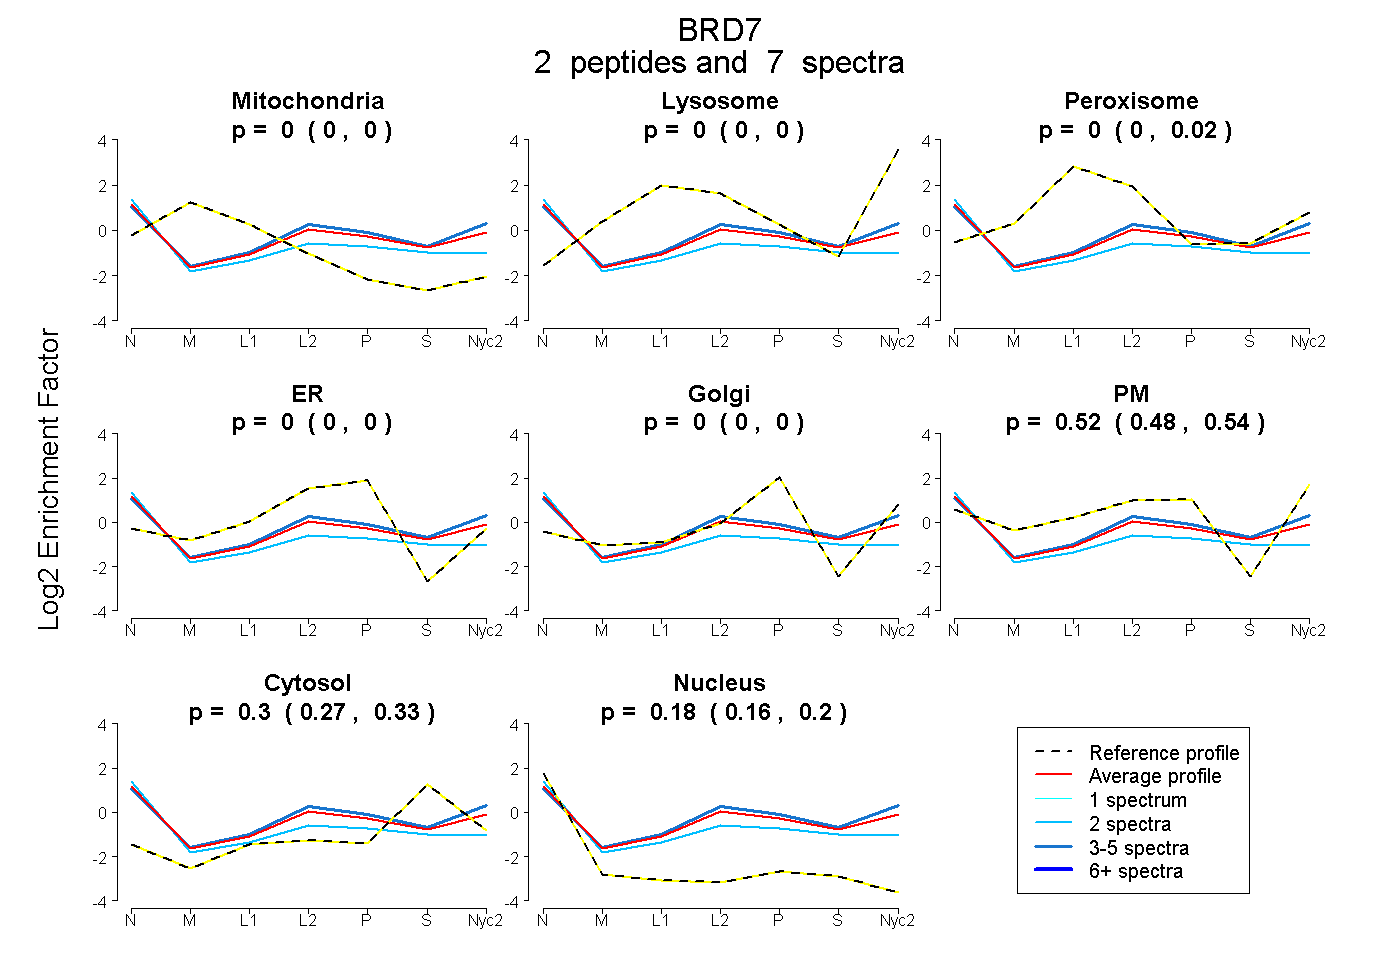
0.000 | 0.000
0.000 | 0.000
0.000 | 0.017
0.000 | 0.000
0.000 | 0.000
0.480 | 0.536
0.273 | 0.325
0.156 | 0.201
3peptides
spectra
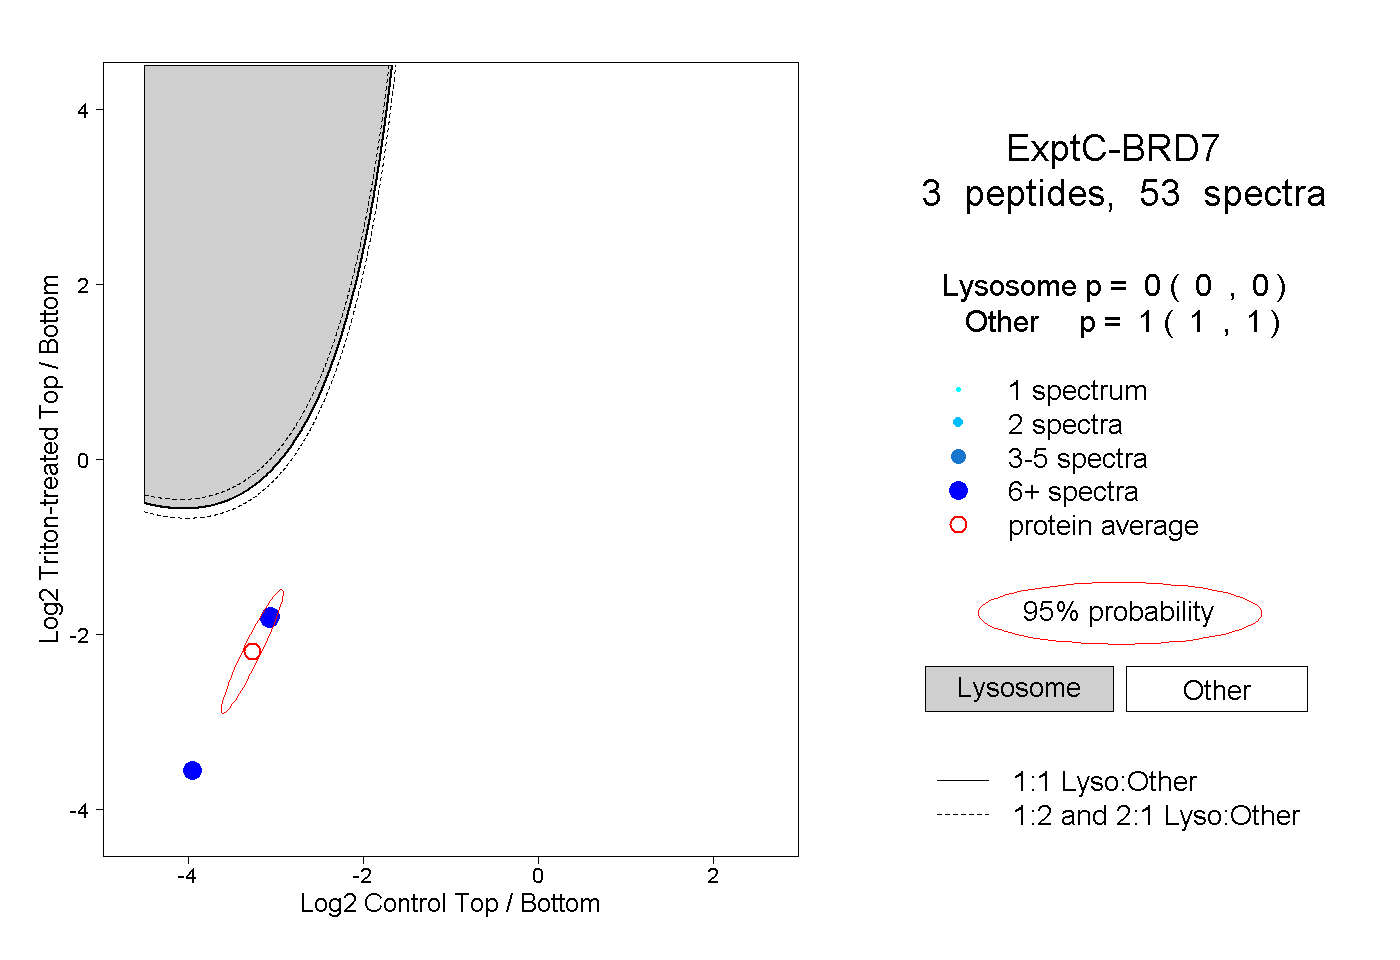
0.000 | 0.000
1.000 | 1.000
1peptide
spectra
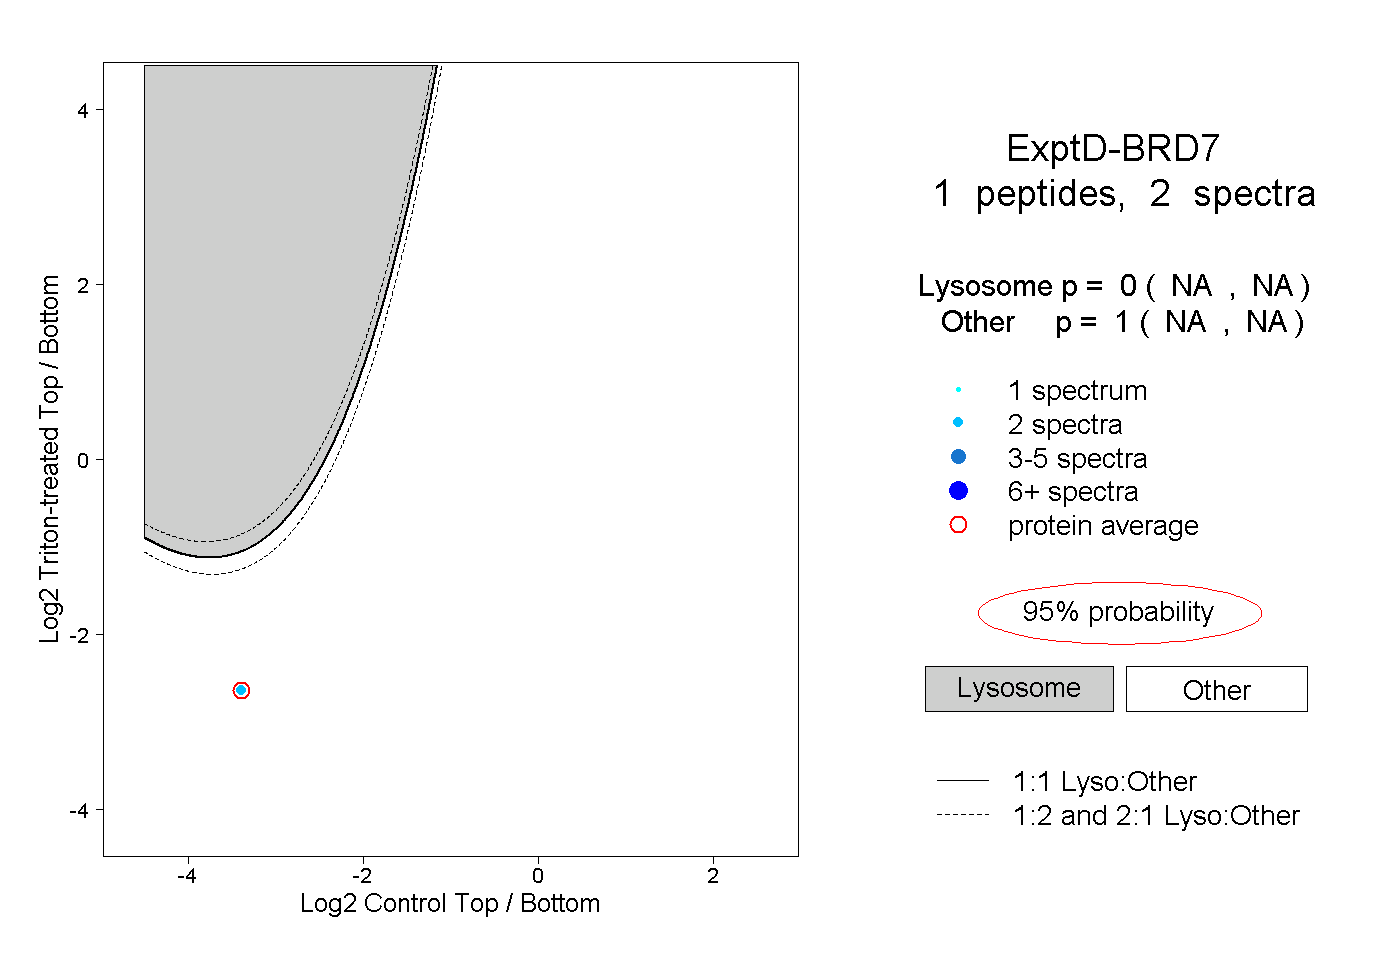
NA | NA
NA | NA