 8
8peptides
spectra
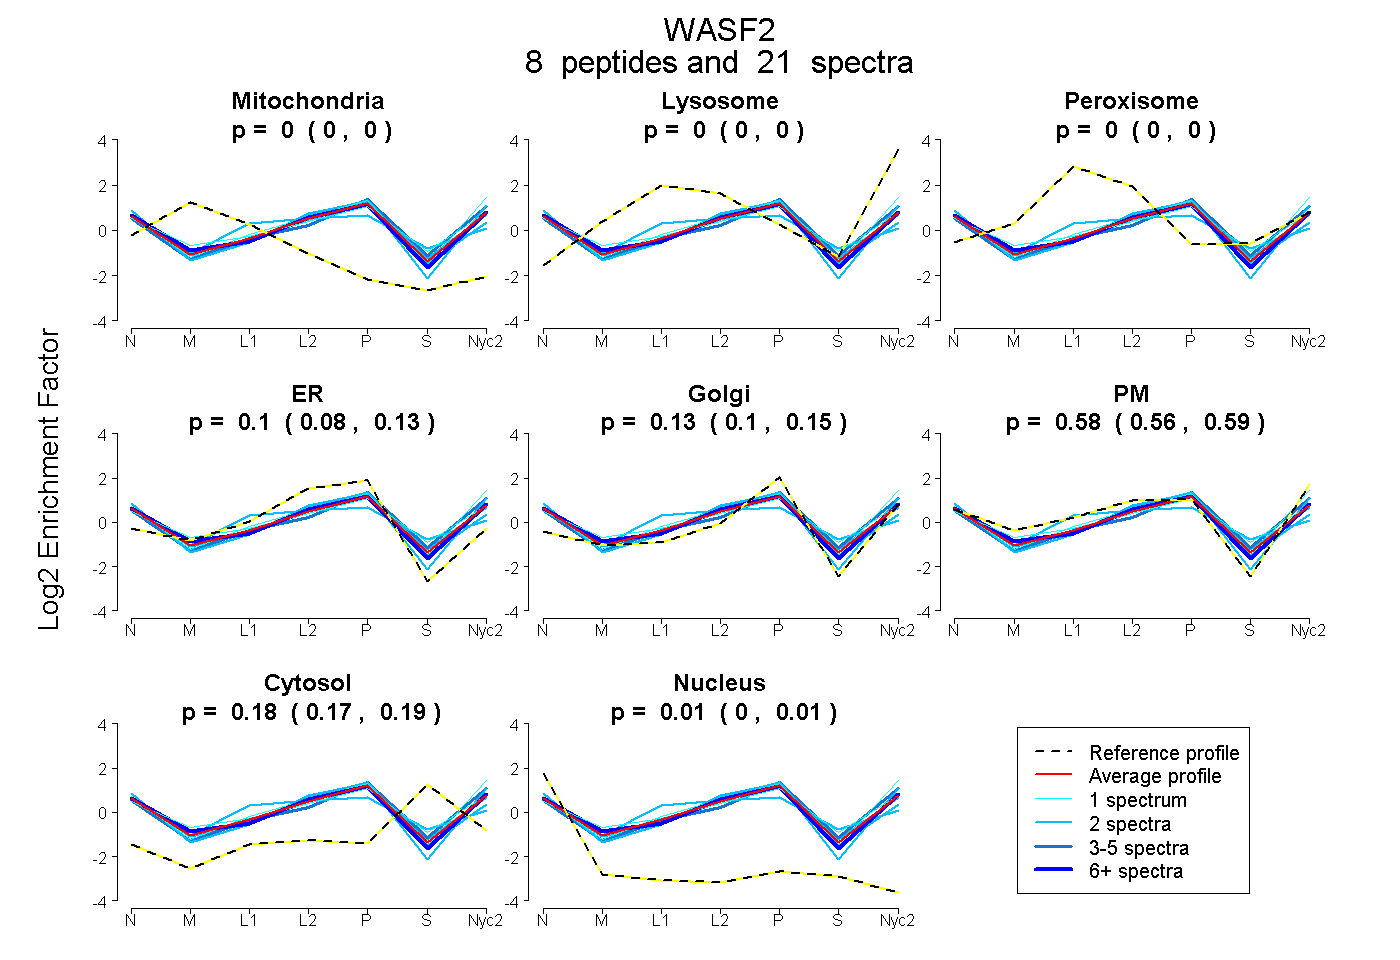
0.000 | 0.000
0.000 | 0.000
0.000 | 0.000
0.080 | 0.127
0.105 | 0.147
0.556 | 0.595
0.170 | 0.191
0.001 | 0.014
2peptides
spectra

0.000 | 0.000
0.000 | 0.131
0.000 | 0.177
0.000 | 0.137
0.606 | 0.826
0.023 | 0.147
0.000 | 0.004
9peptides
spectra
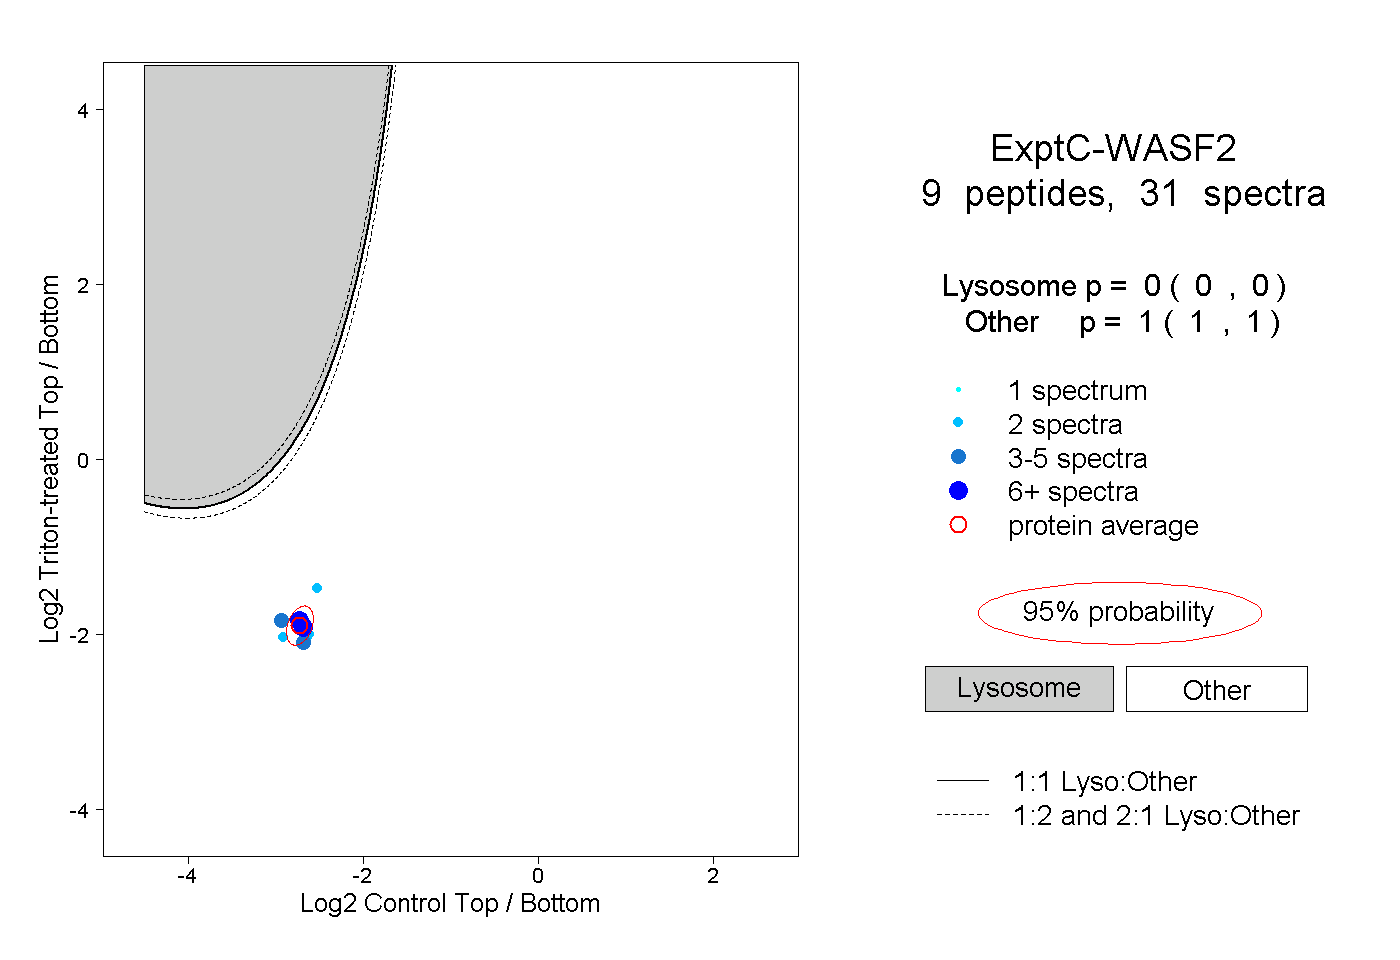
0.000 | 0.000
1.000 | 1.000
2peptides
spectra
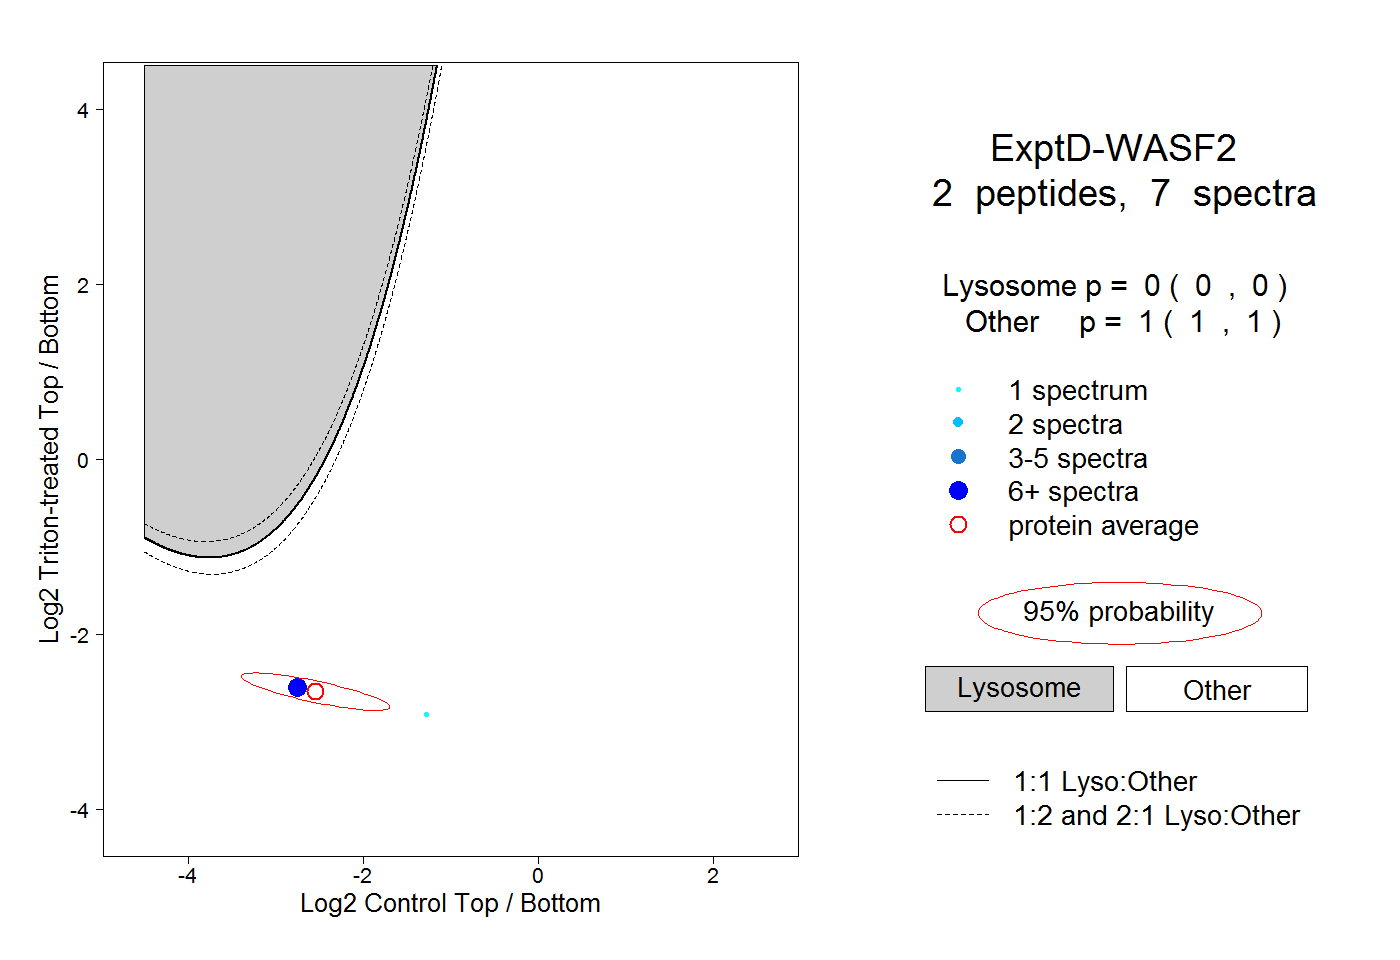
0.000 | 0.000
1.000 | 1.000