 2
2peptides
spectra
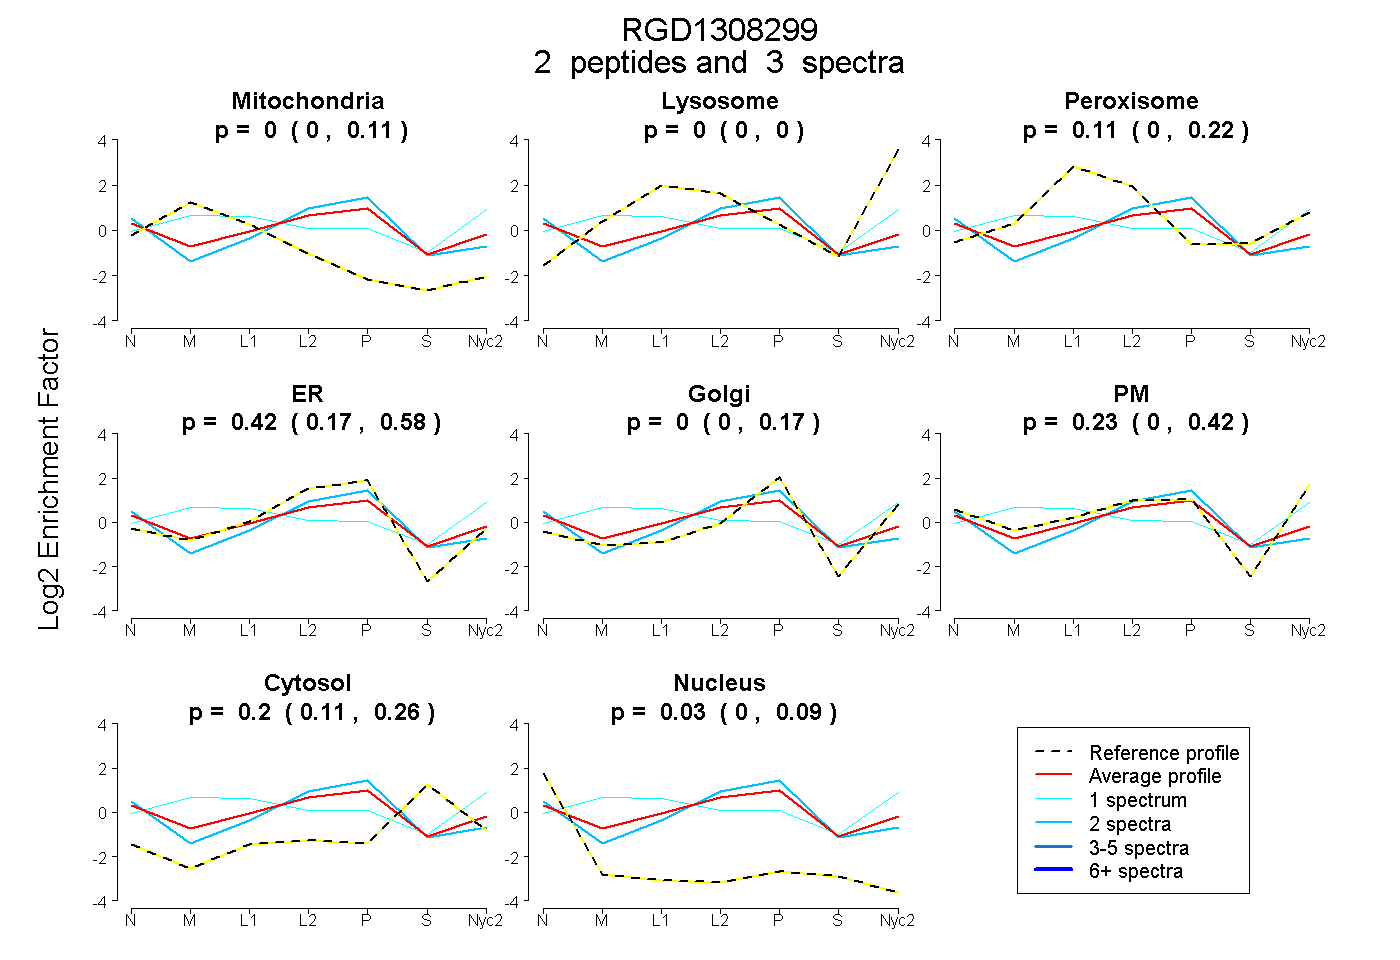
0.000 | 0.110
0.000 | 0.000
0.000 | 0.224
0.174 | 0.583
0.000 | 0.171
0.000 | 0.419
0.112 | 0.262
0.000 | 0.090
1peptide
spectra
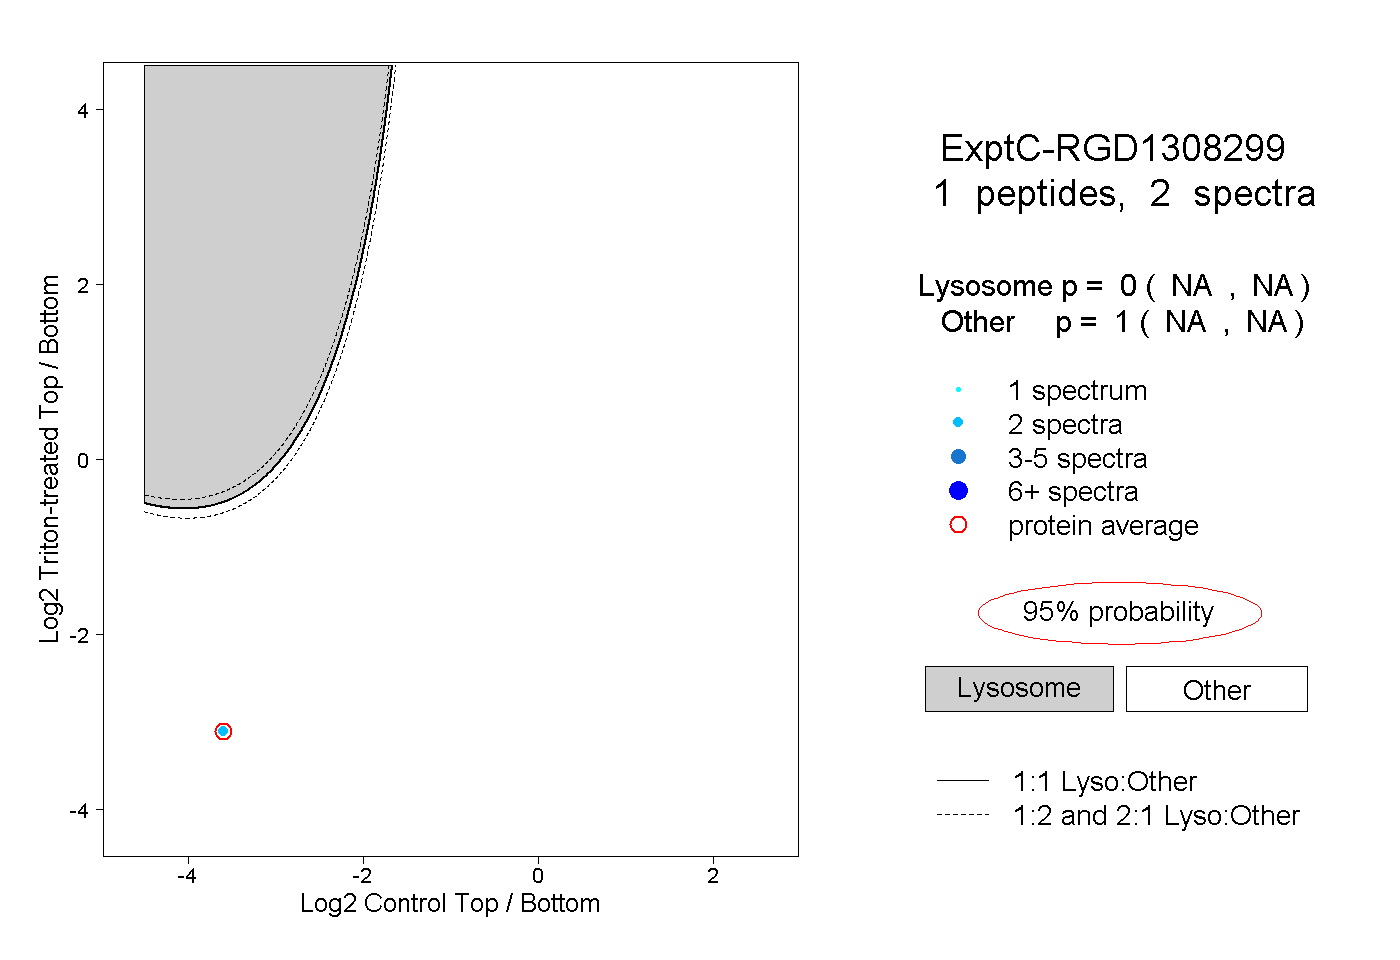
NA | NA
NA | NA
1peptide
spectra
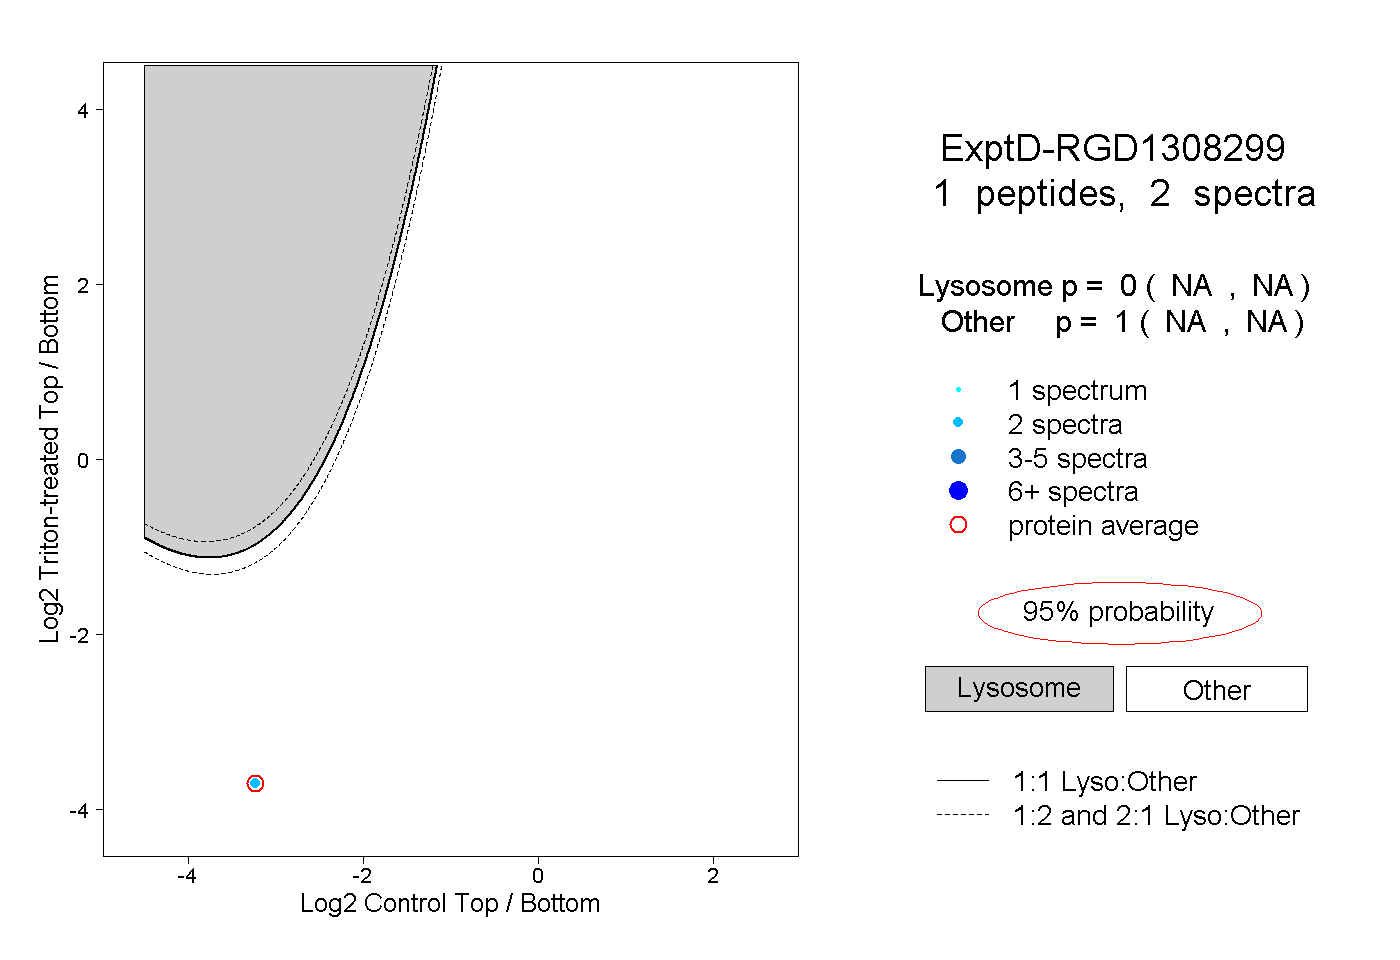
NA | NA
NA | NA