 13
13peptides
spectra
0.000 | 0.000
0.157 | 0.176
0.000 | 0.000
0.000 | 0.000
0.807 | 0.825
0.000 | 0.030
0.000 | 0.000
0.000 | 0.000
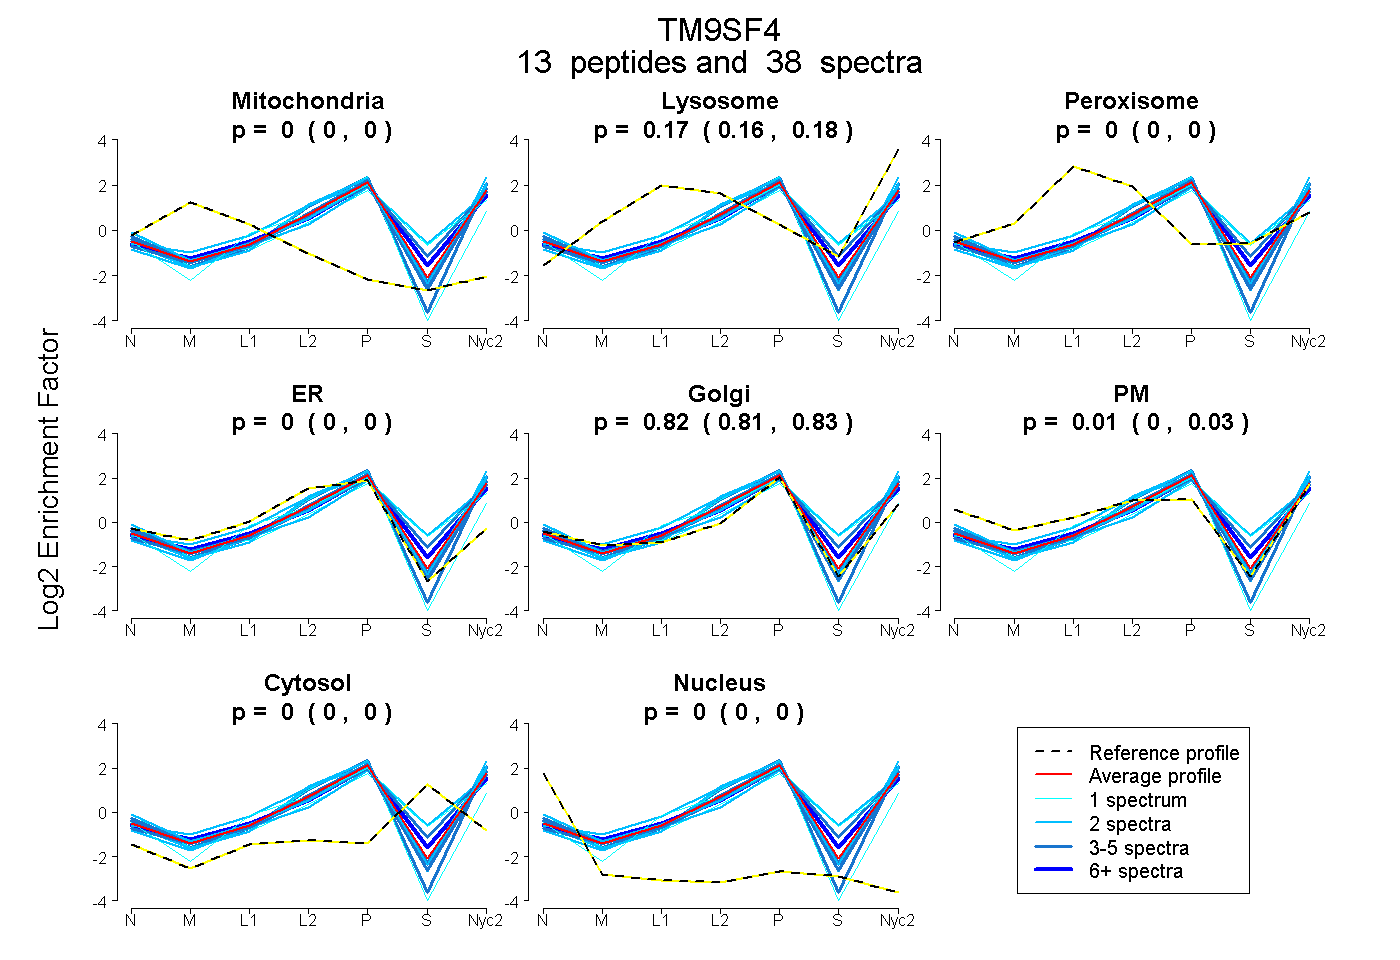
| Plot | Mito | Lyso | Perox | ER | Golgi | PM | Cytosol | Nucleus | |||||
| Expt A |
13 peptides |
38 spectra |
|
0.000 0.000 | 0.000 |
0.168 0.157 | 0.176 |
0.000 0.000 | 0.000 |
0.000 0.000 | 0.000 |
0.817 0.807 | 0.825 |
0.015 0.000 | 0.030 |
0.000 0.000 | 0.000 |
0.000 0.000 | 0.000 |
| 1 spectrum, TQLPYEYYSLPFCQPNK | 0.000 | 0.188 | 0.000 | 0.108 | 0.514 | 0.000 | 0.190 | 0.000 | ||
| 4 spectra, FEVIPQSIR | 0.000 | 0.138 | 0.000 | 0.000 | 0.748 | 0.114 | 0.000 | 0.000 | ||
| 1 spectrum, CEVLCGQSNKPVILTVEQSR | 0.000 | 0.000 | 0.000 | 0.435 | 0.565 | 0.000 | 0.000 | 0.000 | ||
| 2 spectra, QPYDNPVR | 0.000 | 0.082 | 0.000 | 0.000 | 0.677 | 0.241 | 0.000 | 0.000 | ||
| 2 spectra, EDTEEDQEHTYR | 0.000 | 0.146 | 0.000 | 0.000 | 0.756 | 0.098 | 0.000 | 0.000 | ||
| 6 spectra, ITEEYYVHLIADNLPVATR | 0.000 | 0.190 | 0.000 | 0.000 | 0.771 | 0.000 | 0.039 | 0.000 | ||
| 2 spectra, DVQFEHGYR | 0.000 | 0.192 | 0.000 | 0.000 | 0.609 | 0.000 | 0.199 | 0.000 | ||
| 1 spectrum, DIANYNK | 0.000 | 0.103 | 0.000 | 0.000 | 0.566 | 0.134 | 0.197 | 0.000 | ||
| 5 spectra, LELYSSNR | 0.000 | 0.077 | 0.000 | 0.000 | 0.725 | 0.199 | 0.000 | 0.000 | ||
| 2 spectra, IVNTPFQVLMNSEK | 0.000 | 0.263 | 0.000 | 0.047 | 0.615 | 0.075 | 0.000 | 0.000 | ||
| 5 spectra, QIPEQR | 0.000 | 0.122 | 0.000 | 0.000 | 0.791 | 0.087 | 0.000 | 0.000 | ||
| 4 spectra, LGFTDVNK | 0.000 | 0.206 | 0.000 | 0.000 | 0.701 | 0.000 | 0.093 | 0.000 | ||
| 3 spectra, AENLGEVLR | 0.000 | 0.018 | 0.000 | 0.000 | 0.701 | 0.280 | 0.000 | 0.000 |
| Plot | Mito | Lyso or Perox | ER | Golgi | PM | Cytosol | Nucleus | ||||||
| Expt B |
7 peptides |
10 spectra |
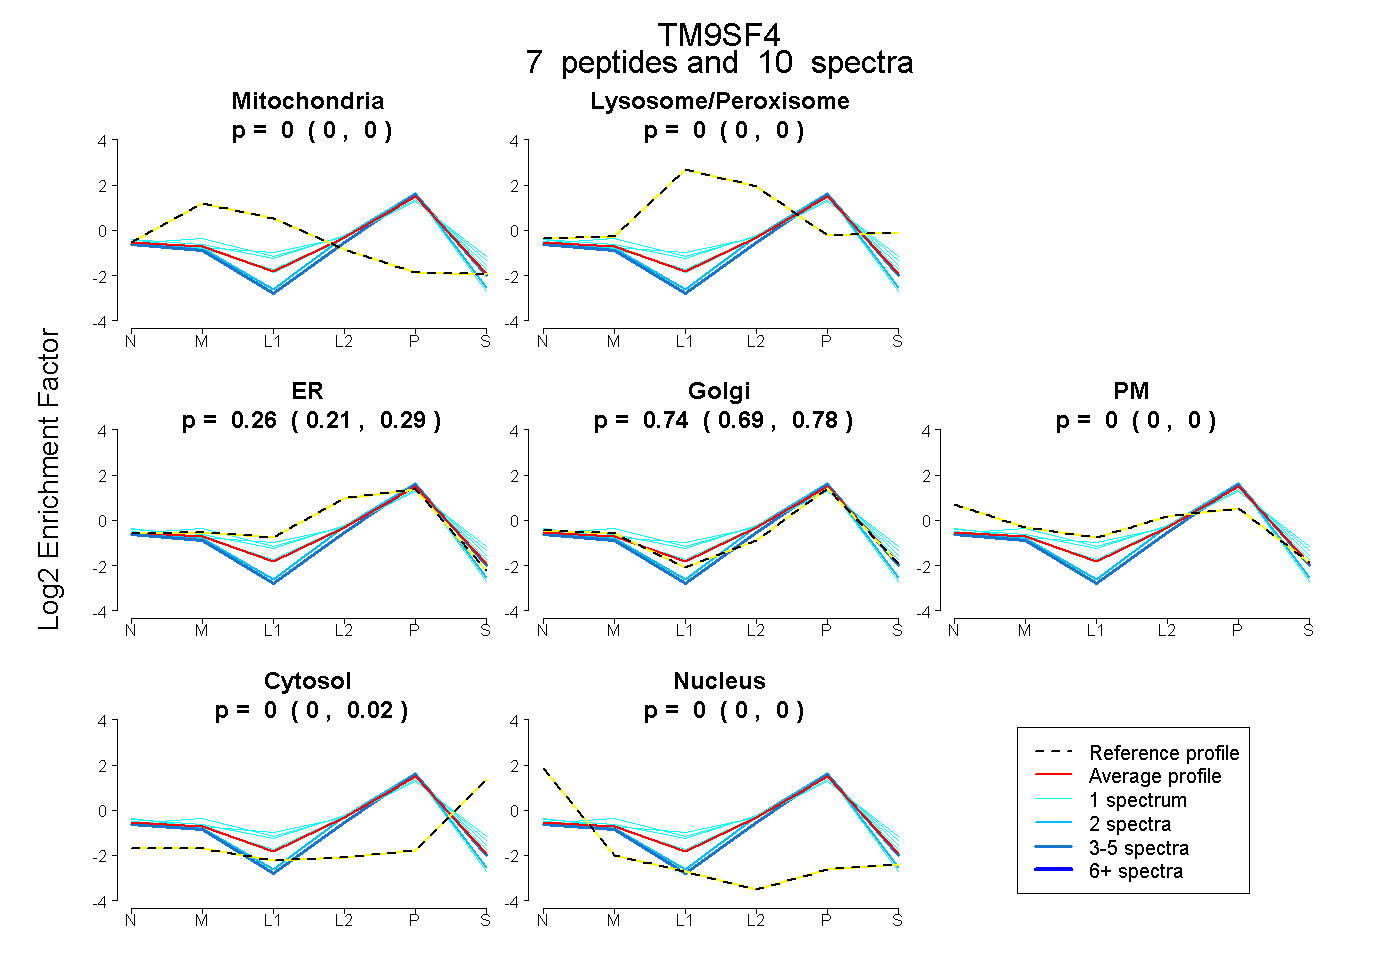 |
0.000 0.000 | 0.000 |
0.000 0.000 | 0.000 |
0.258 0.213 | 0.292 |
0.739 0.694 | 0.776 |
0.000 0.000 | 0.000 |
0.003 0.000 | 0.019 |
0.000 0.000 | 0.000 |
|||
| Plot | Lyso | Other | |||||||||||
| Expt C |
13 peptides |
77 spectra |
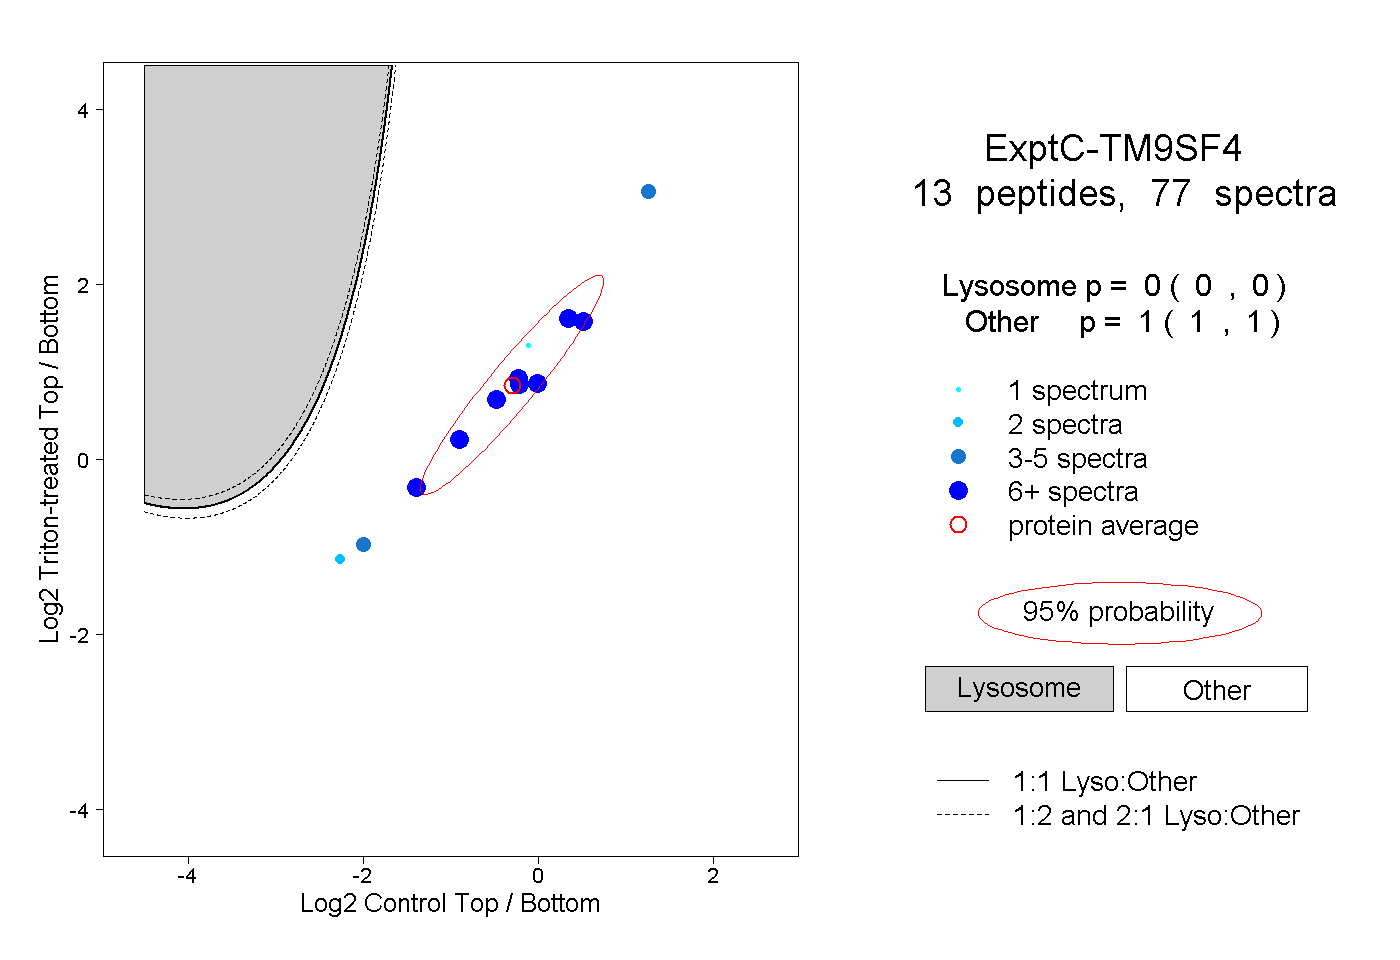 |
0.000 0.000 | 0.000 |
1.000 1.000 | 1.000 |
||||||||
| Plot | Lyso | Other | |||||||||||
| Expt D |
5 peptides |
7 spectra |
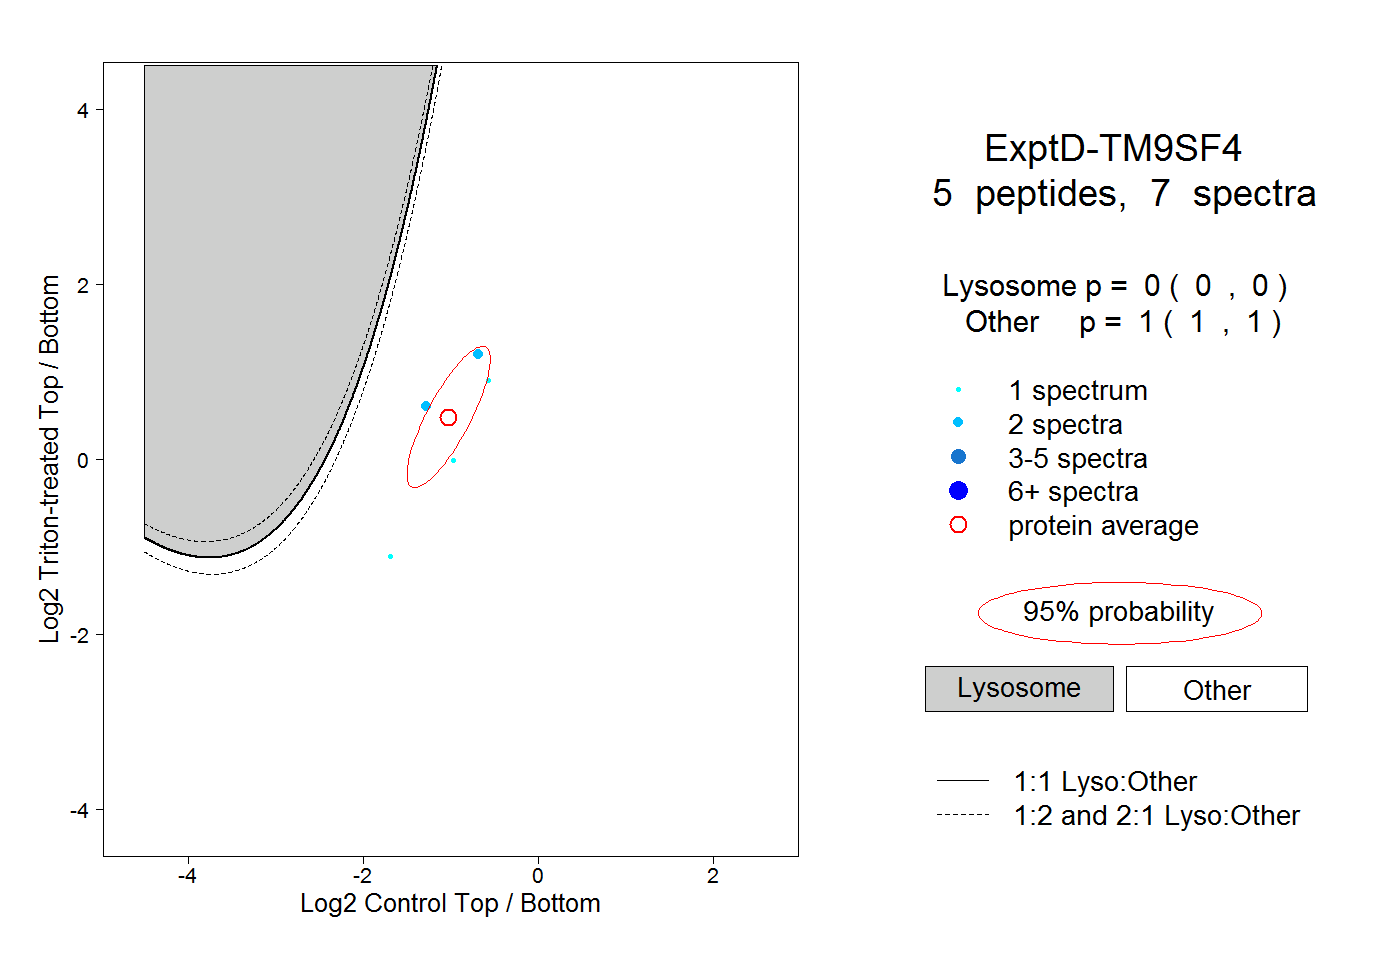 |
0.000 0.000 | 0.000 |
1.000 1.000 | 1.000 |