10
10peptides
spectra
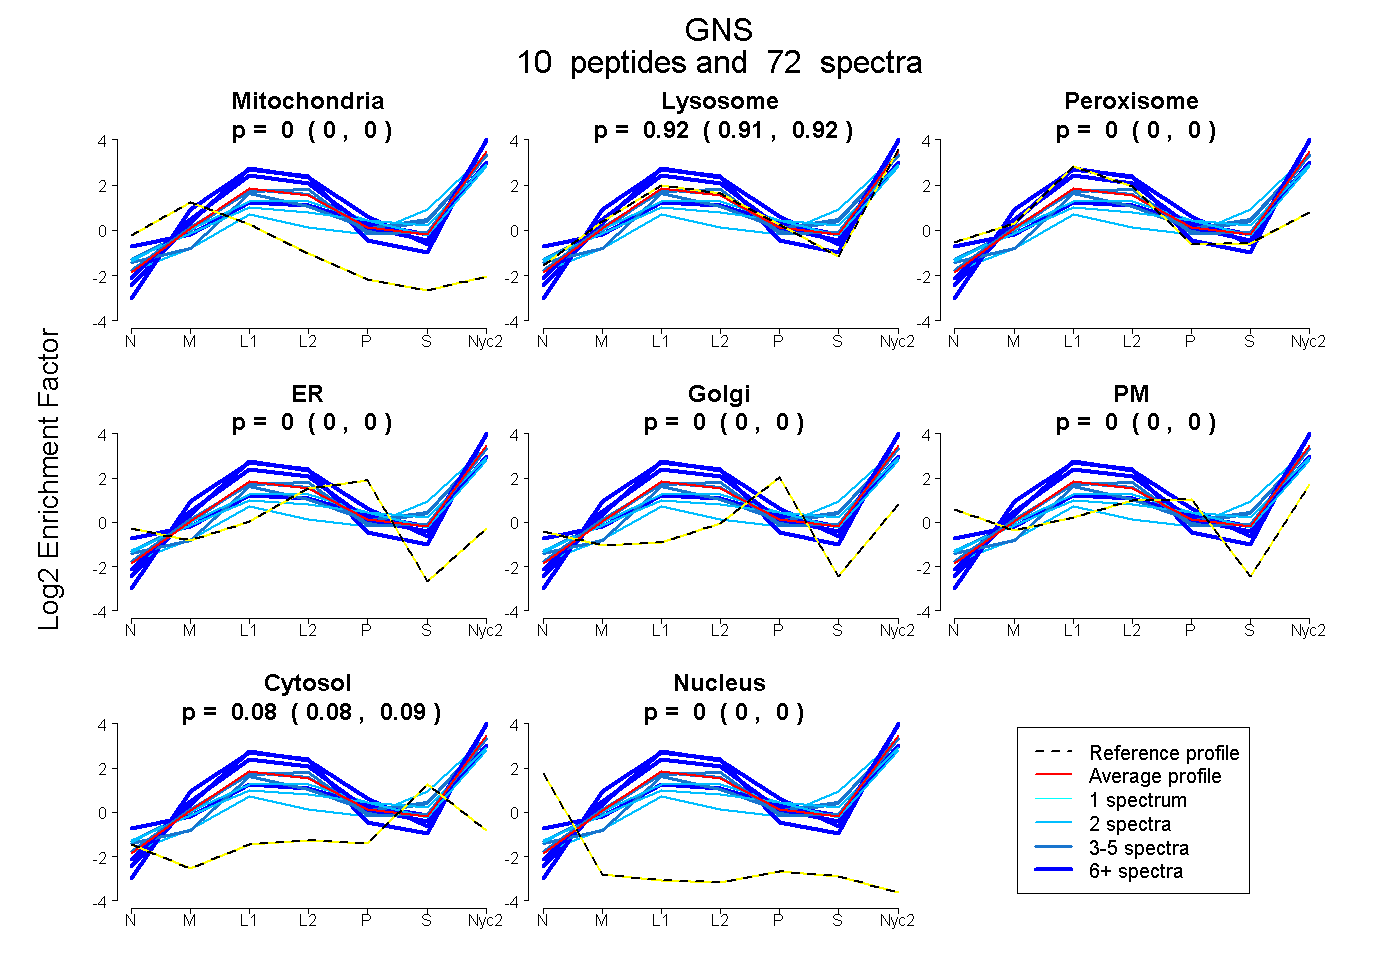
0.000 | 0.000
0.913 | 0.923
0.000 | 0.000
0.000 | 0.000
0.000 | 0.000
0.000 | 0.000
0.077 | 0.087
0.000 | 0.000
11peptides
spectra
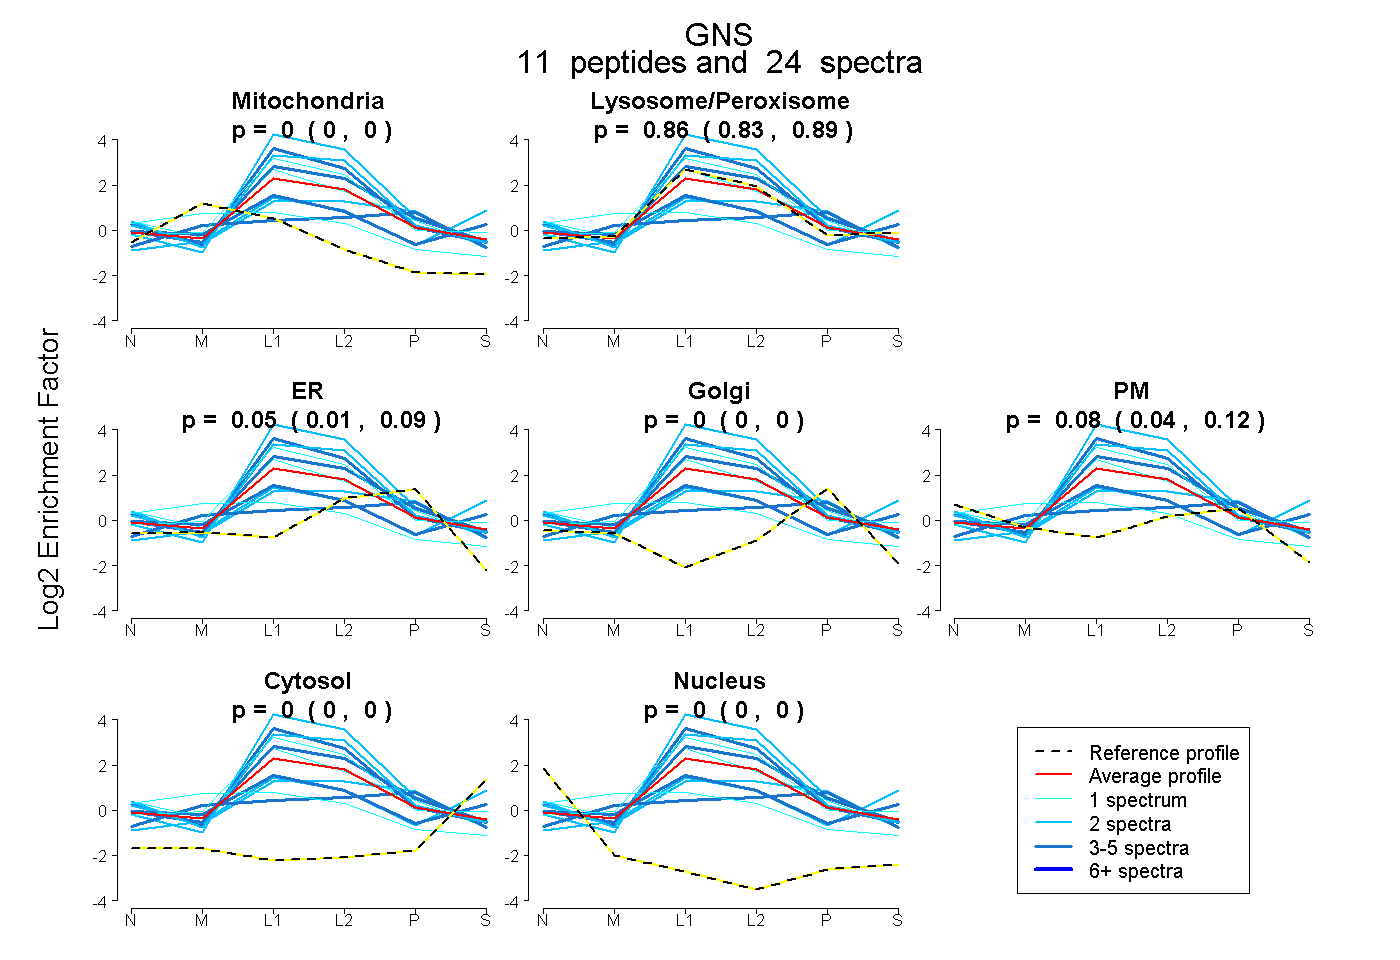
0.000 | 0.000
0.832 | 0.888
0.008 | 0.092
0.000 | 0.000
0.037 | 0.123
0.000 | 0.000
0.000 | 0.000