19
19peptides
spectra
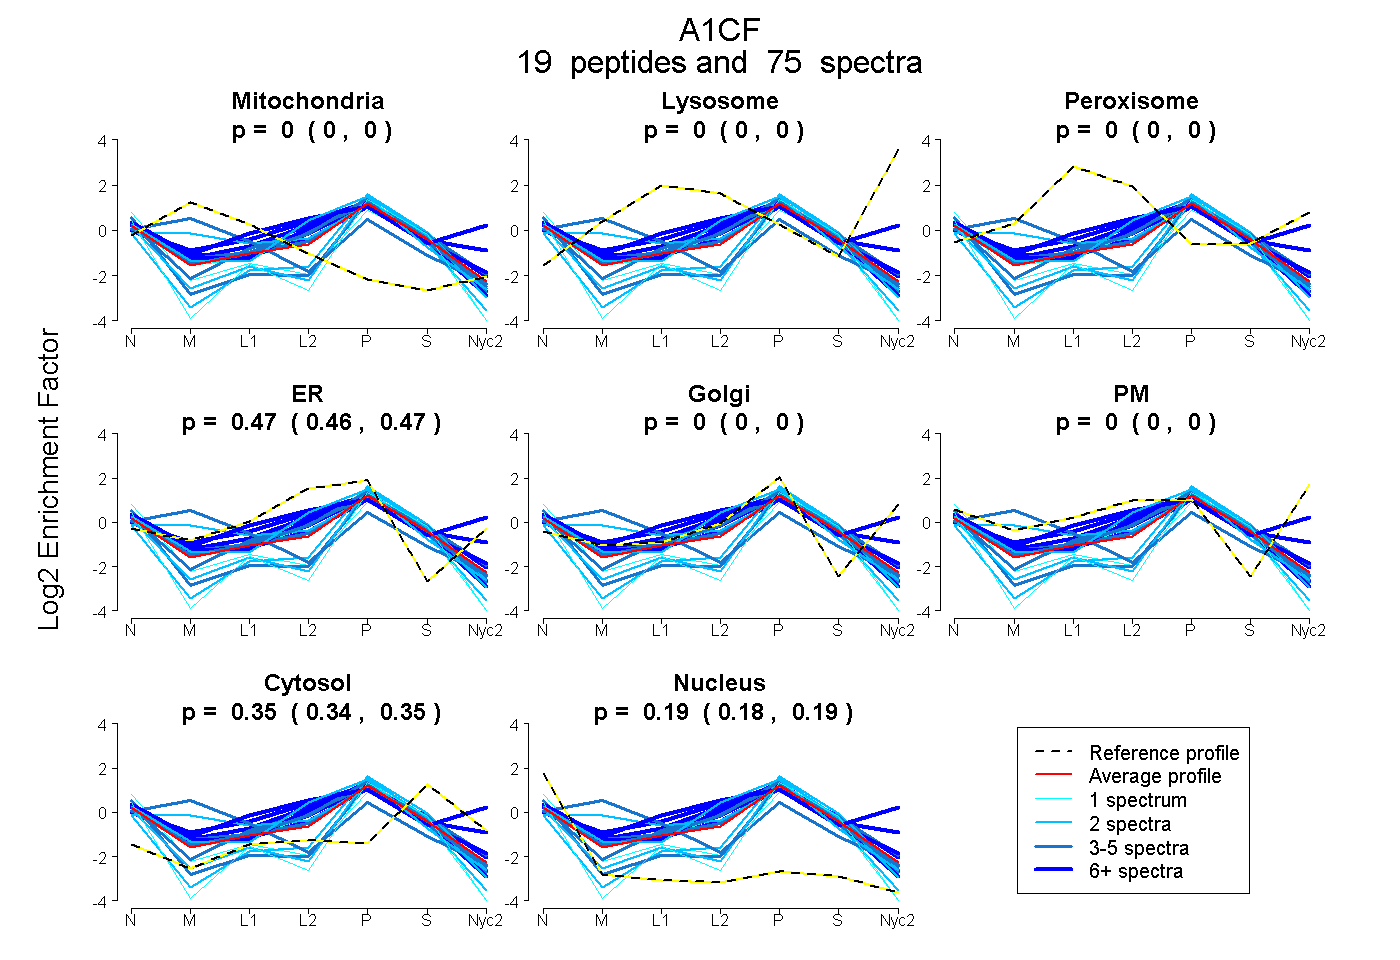
0.000 | 0.000
0.000 | 0.000
0.000 | 0.000
0.462 | 0.472
0.000 | 0.000
0.000 | 0.000
0.343 | 0.350
0.180 | 0.190
8peptides
spectra
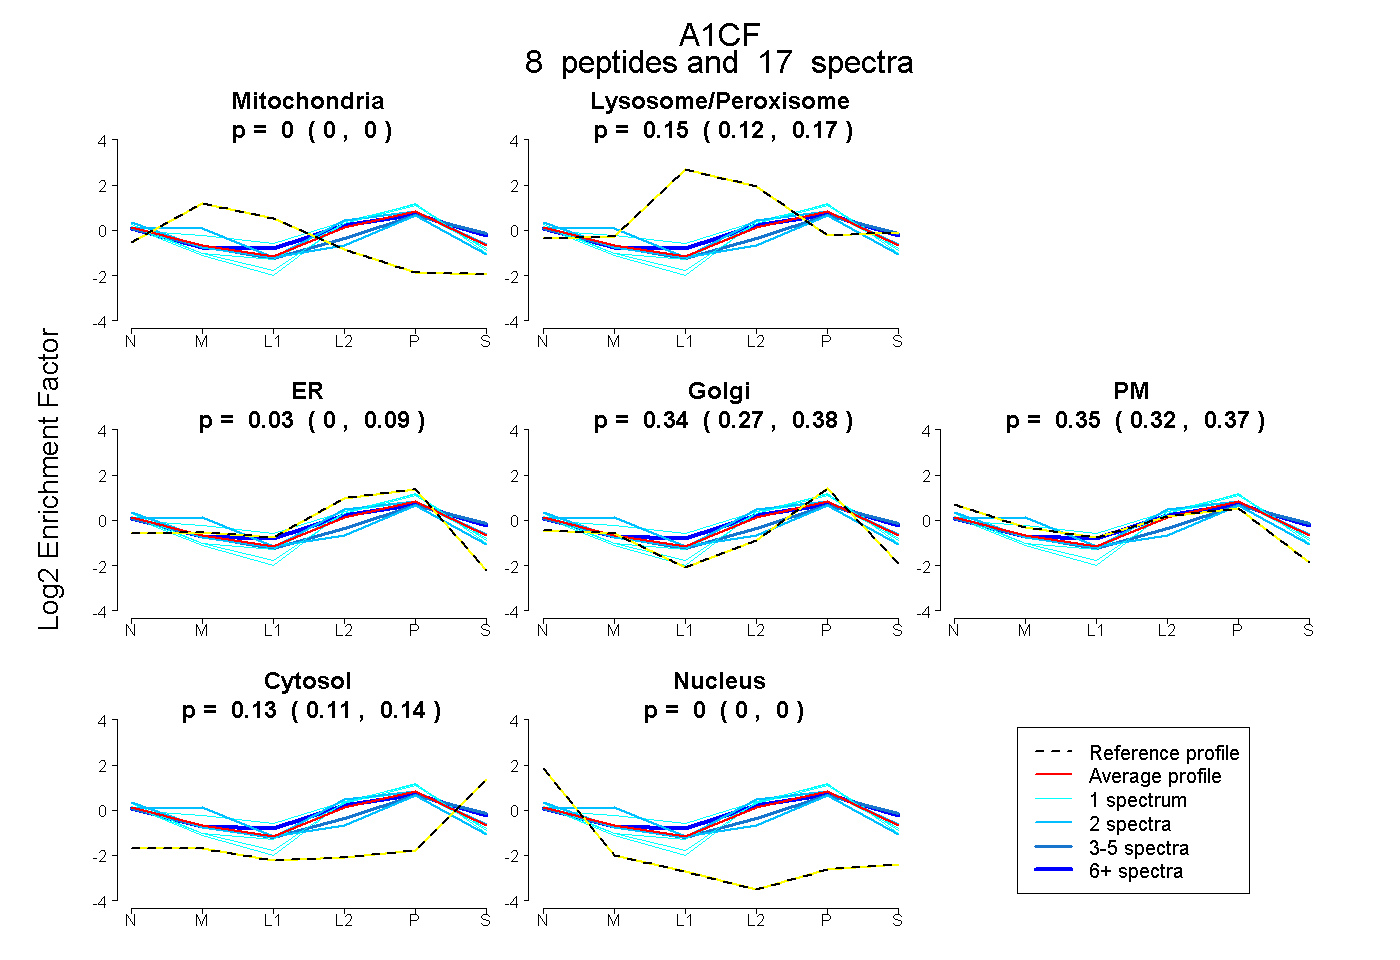
0.000 | 0.000
0.123 | 0.173
0.000 | 0.087
0.271 | 0.380
0.324 | 0.373
0.113 | 0.141
0.000 | 0.000