 19
19peptides
spectra
0.000 | 0.000
0.000 | 0.000
0.000 | 0.000
0.462 | 0.472
0.000 | 0.000
0.000 | 0.000
0.343 | 0.350
0.180 | 0.190
| Plot | Mito | Lyso | Perox | ER | Golgi | PM | Cytosol | Nucleus | |||||
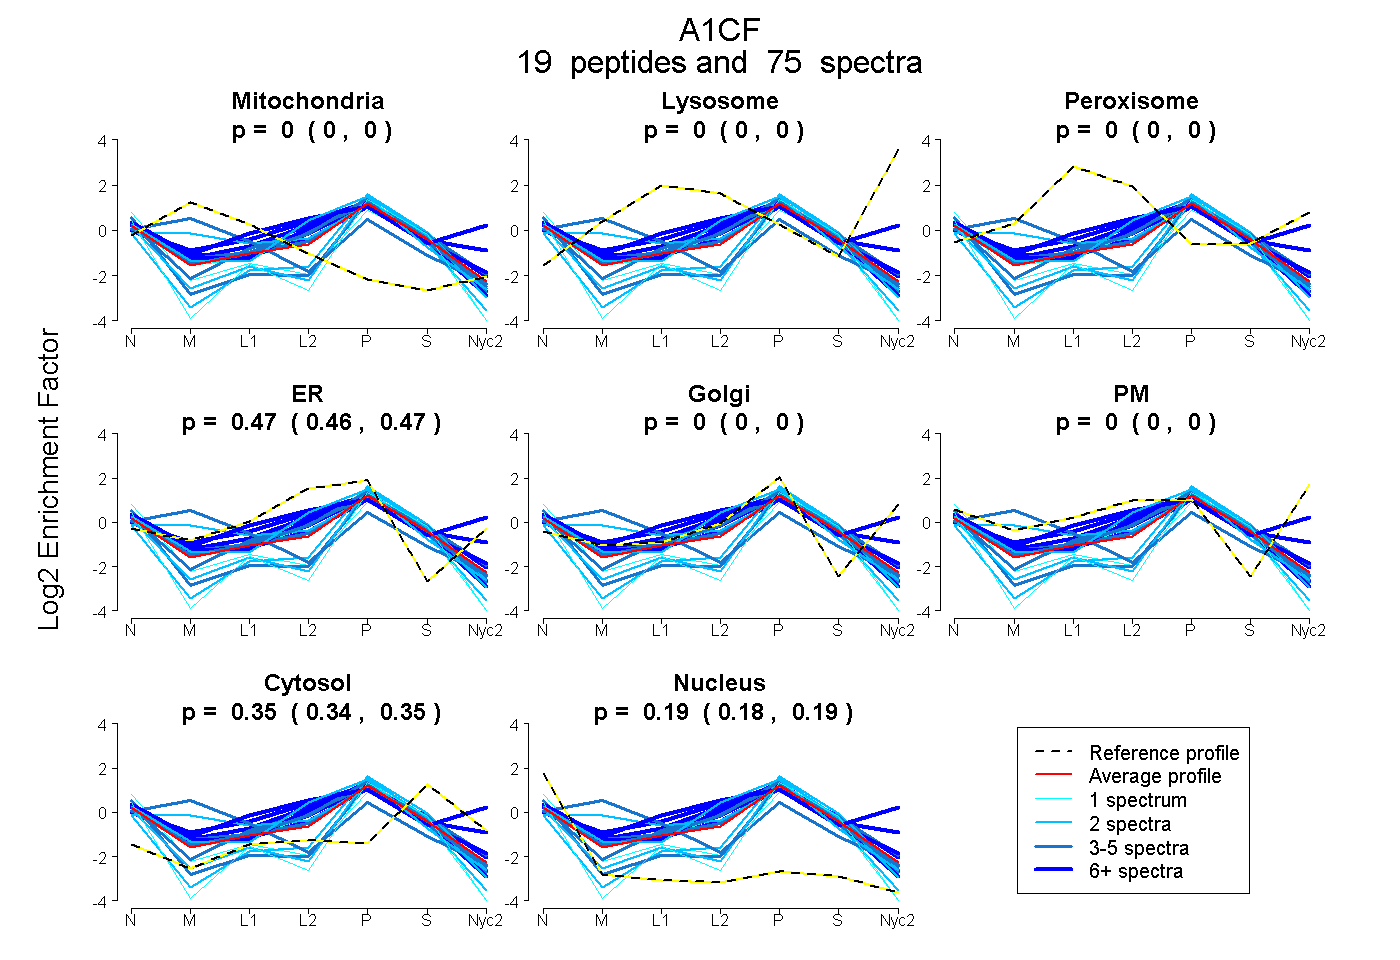
| Expt A |
19 peptides |
75 spectra |
|
0.000 0.000 | 0.000 |
0.000 0.000 | 0.000 |
0.000 0.000 | 0.000 |
0.468 0.462 | 0.472 |
0.000 0.000 | 0.000 |
0.000 0.000 | 0.000 |
0.347 0.343 | 0.350 |
0.185 0.180 | 0.190 |
| 2 spectra, TGYSLVQENGQR | 0.000 | 0.000 | 0.000 | 0.590 | 0.000 | 0.000 | 0.225 | 0.185 | ||
| 6 spectra, LLGVCASVDNCR | 0.000 | 0.000 | 0.000 | 0.535 | 0.000 | 0.000 | 0.267 | 0.198 | ||
| 8 spectra, SGDGLSGTQK | 0.000 | 0.000 | 0.045 | 0.272 | 0.000 | 0.379 | 0.304 | 0.000 | ||
| 9 spectra, EDAVEAMK | 0.000 | 0.000 | 0.026 | 0.612 | 0.000 | 0.000 | 0.362 | 0.000 | ||
| 1 spectrum, EFNSIKPGAVER | 0.000 | 0.000 | 0.000 | 0.484 | 0.000 | 0.000 | 0.237 | 0.279 | ||
| 4 spectra, GYAFVTFSNK | 0.000 | 0.000 | 0.000 | 0.477 | 0.000 | 0.000 | 0.337 | 0.186 | ||
| 2 spectra, NNWGQPVYQLHSAIGQDQR | 0.000 | 0.000 | 0.000 | 0.065 | 0.249 | 0.000 | 0.371 | 0.315 | ||
| 8 spectra, GFAFVEYESHR | 0.000 | 0.000 | 0.000 | 0.585 | 0.000 | 0.000 | 0.312 | 0.103 | ||
| 3 spectra, LSAYVDEAK | 0.000 | 0.000 | 0.000 | 0.000 | 0.324 | 0.000 | 0.339 | 0.337 | ||
| 2 spectra, LAPQILEEICQK | 0.000 | 0.000 | 0.000 | 0.119 | 0.183 | 0.000 | 0.458 | 0.241 | ||
| 1 spectrum, VTIPALASQNPAIHPFTPPK | 0.000 | 0.000 | 0.000 | 0.146 | 0.000 | 0.000 | 0.404 | 0.450 | ||
| 3 spectra, QLFLYK | 0.496 | 0.000 | 0.000 | 0.000 | 0.275 | 0.000 | 0.149 | 0.080 | ||
| 1 spectrum, GYLAYTGLGR | 0.000 | 0.000 | 0.000 | 0.110 | 0.227 | 0.000 | 0.321 | 0.341 | ||
| 3 spectra, QLNNYEIR | 0.000 | 0.000 | 0.000 | 0.534 | 0.000 | 0.000 | 0.290 | 0.176 | ||
| 4 spectra, LFVGGIPK | 0.000 | 0.000 | 0.000 | 0.471 | 0.000 | 0.000 | 0.360 | 0.169 | ||
| 2 spectra, NLMLSTSEEMIEK | 0.238 | 0.000 | 0.000 | 0.415 | 0.000 | 0.000 | 0.226 | 0.121 | ||
| 6 spectra, DLFEDELIPLCEK | 0.000 | 0.000 | 0.000 | 0.455 | 0.000 | 0.000 | 0.375 | 0.169 | ||
| 3 spectra, GCEIFIGK | 0.000 | 0.000 | 0.000 | 0.508 | 0.000 | 0.000 | 0.392 | 0.100 | ||
| 7 spectra, EEILSEMK | 0.000 | 0.000 | 0.000 | 0.501 | 0.000 | 0.000 | 0.367 | 0.131 |
| Plot | Mito | Lyso or Perox | ER | Golgi | PM | Cytosol | Nucleus | ||||||
| Expt B |
8 peptides |
17 spectra |
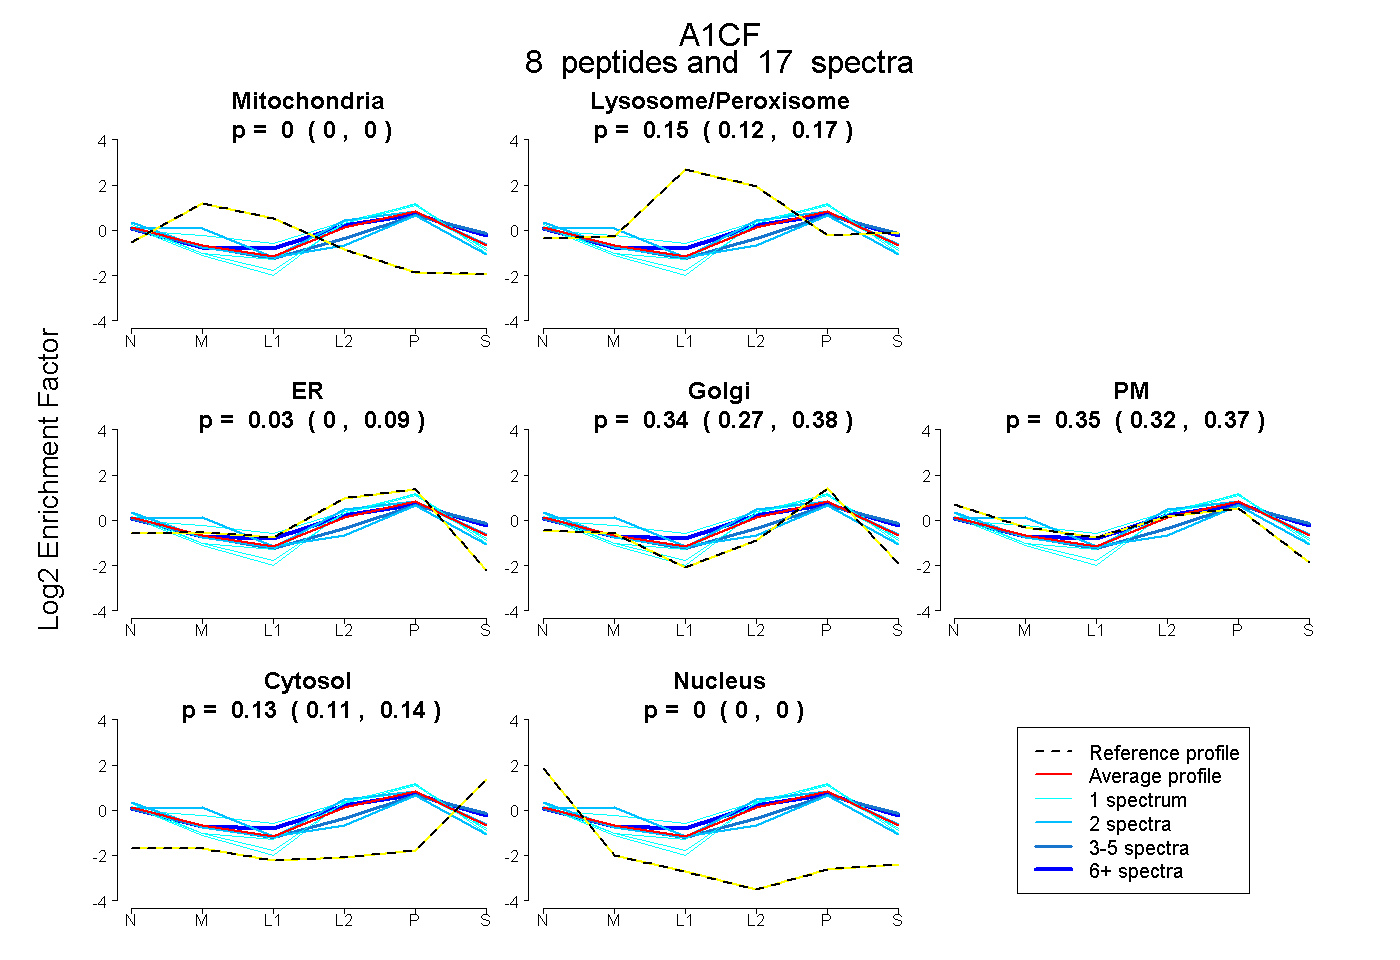 |
0.000 0.000 | 0.000 |
0.154 0.123 | 0.173 |
0.027 0.000 | 0.087 |
0.343 0.271 | 0.380 |
0.350 0.324 | 0.373 |
0.126 0.113 | 0.141 |
0.000 0.000 | 0.000 |
|||
| Plot | Lyso | Other | |||||||||||
| Expt C |
13 peptides |
57 spectra |
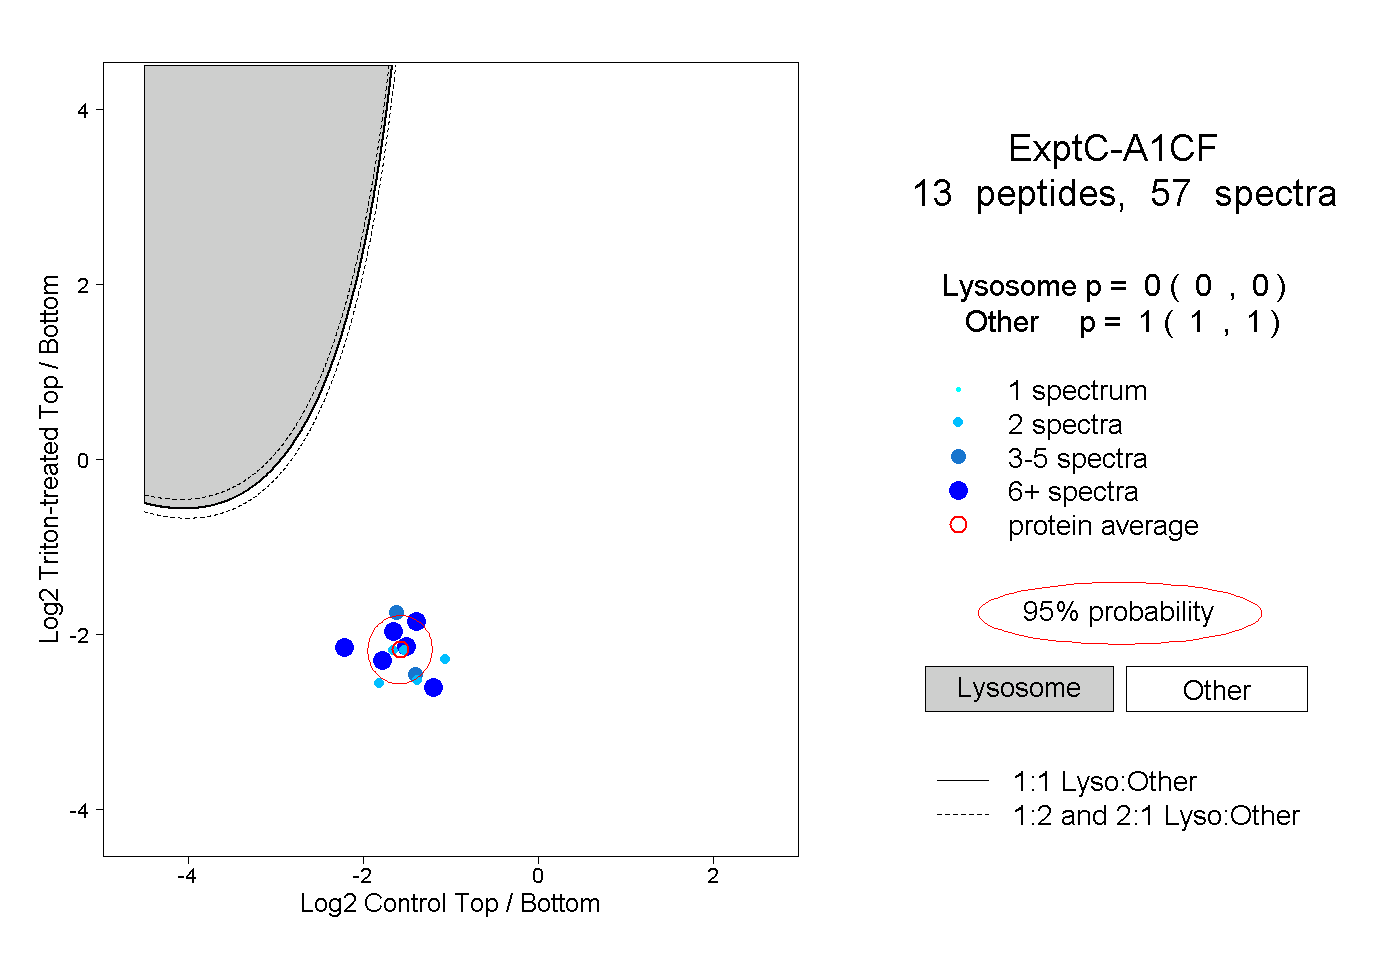 |
0.000 0.000 | 0.000 |
1.000 1.000 | 1.000 |
||||||||
| Plot | Lyso | Other | |||||||||||
| Expt D |
7 peptides |
15 spectra |
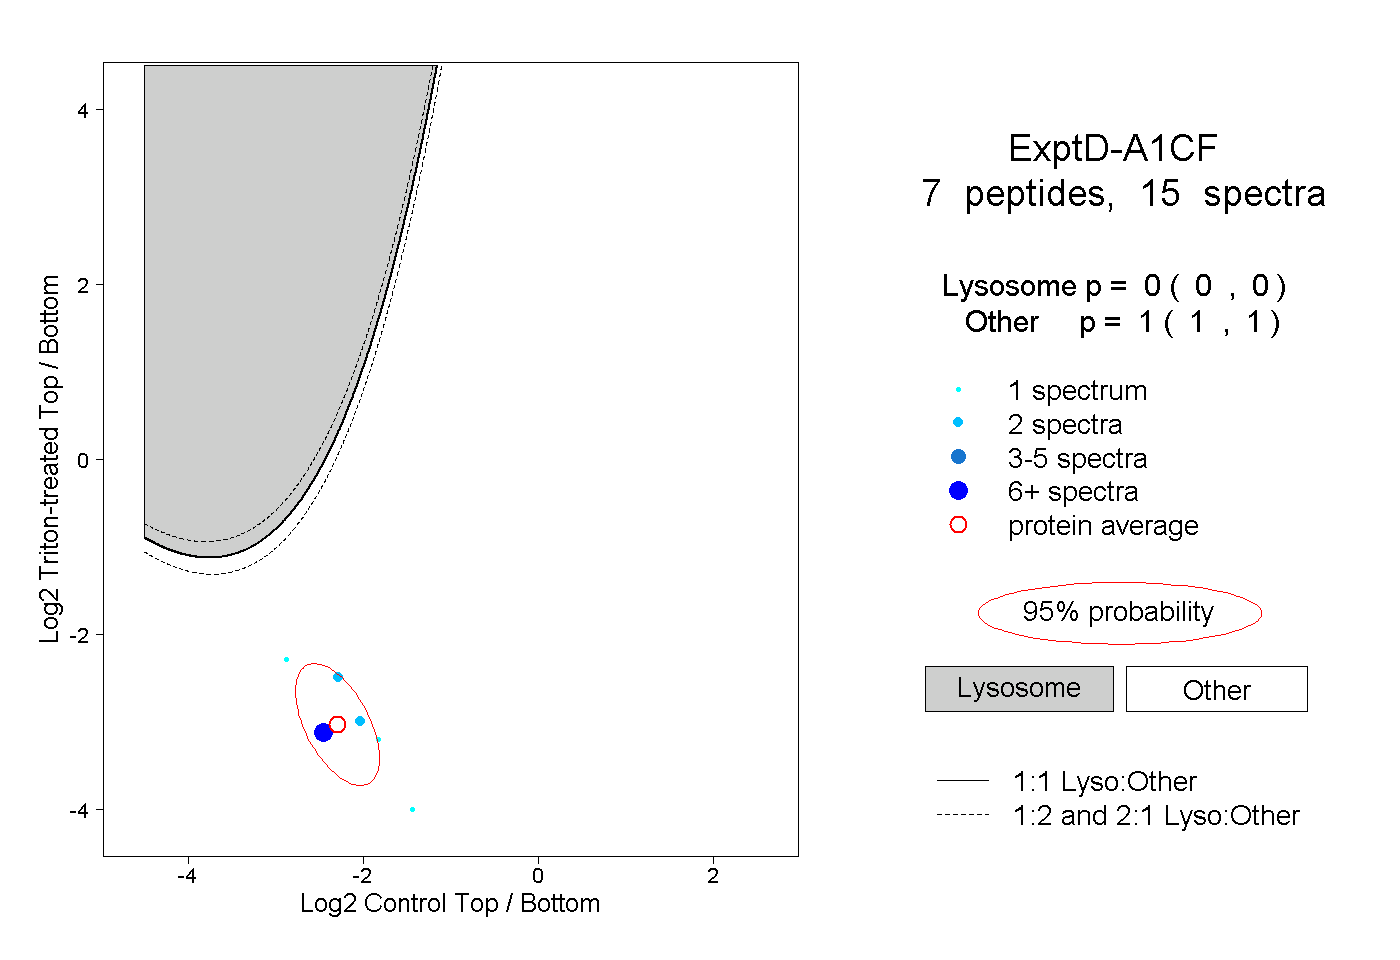 |
0.000 0.000 | 0.000 |
1.000 1.000 | 1.000 |