 3
3peptides
spectra
0.012 | 0.141
0.000 | 0.000
0.024 | 0.139
0.000 | 0.239
0.000 | 0.203
0.000 | 0.000
0.586 | 0.674
0.000 | 0.000
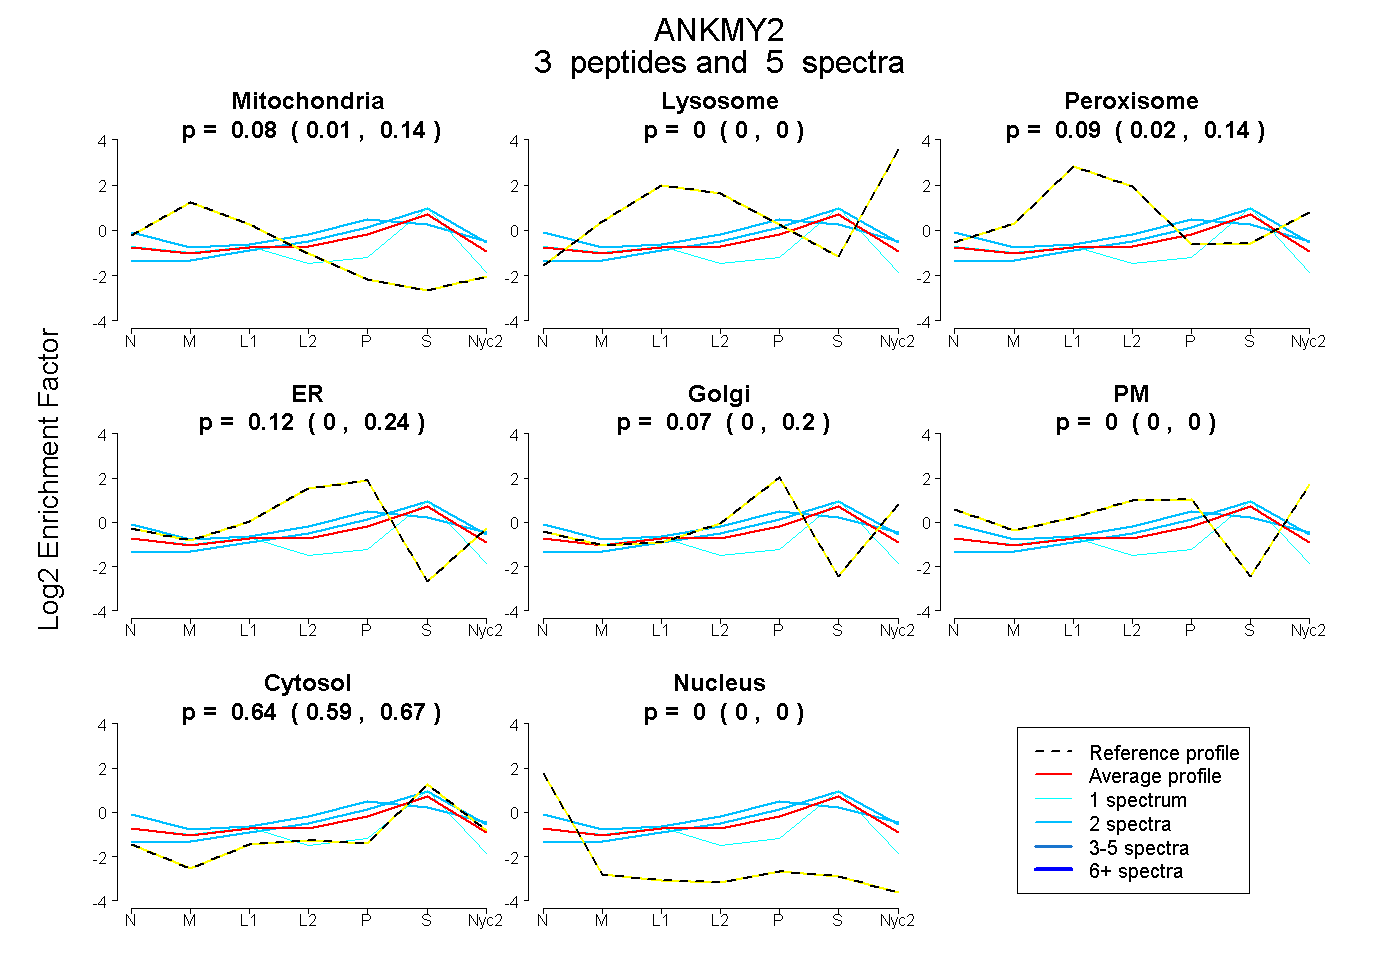
| Plot | Mito | Lyso | Perox | ER | Golgi | PM | Cytosol | Nucleus | |||||
| Expt A |
3 peptides |
5 spectra |
|
0.080 0.012 | 0.141 |
0.000 0.000 | 0.000 |
0.091 0.024 | 0.139 |
0.120 0.000 | 0.239 |
0.072 0.000 | 0.203 |
0.000 0.000 | 0.000 |
0.637 0.586 | 0.674 |
0.000 0.000 | 0.000 |
| 1 spectrum, VMDLICEK | 0.278 | 0.000 | 0.000 | 0.000 | 0.000 | 0.000 | 0.722 | 0.000 | ||
| 2 spectra, THWFAHK | 0.000 | 0.046 | 0.057 | 0.128 | 0.081 | 0.000 | 0.688 | 0.000 | ||
| 2 spectra, MHYISCIFQK | 0.025 | 0.000 | 0.101 | 0.180 | 0.134 | 0.086 | 0.474 | 0.000 |
| Plot | Lyso | Other | |||||||||||
| Expt C |
2 peptides |
5 spectra |
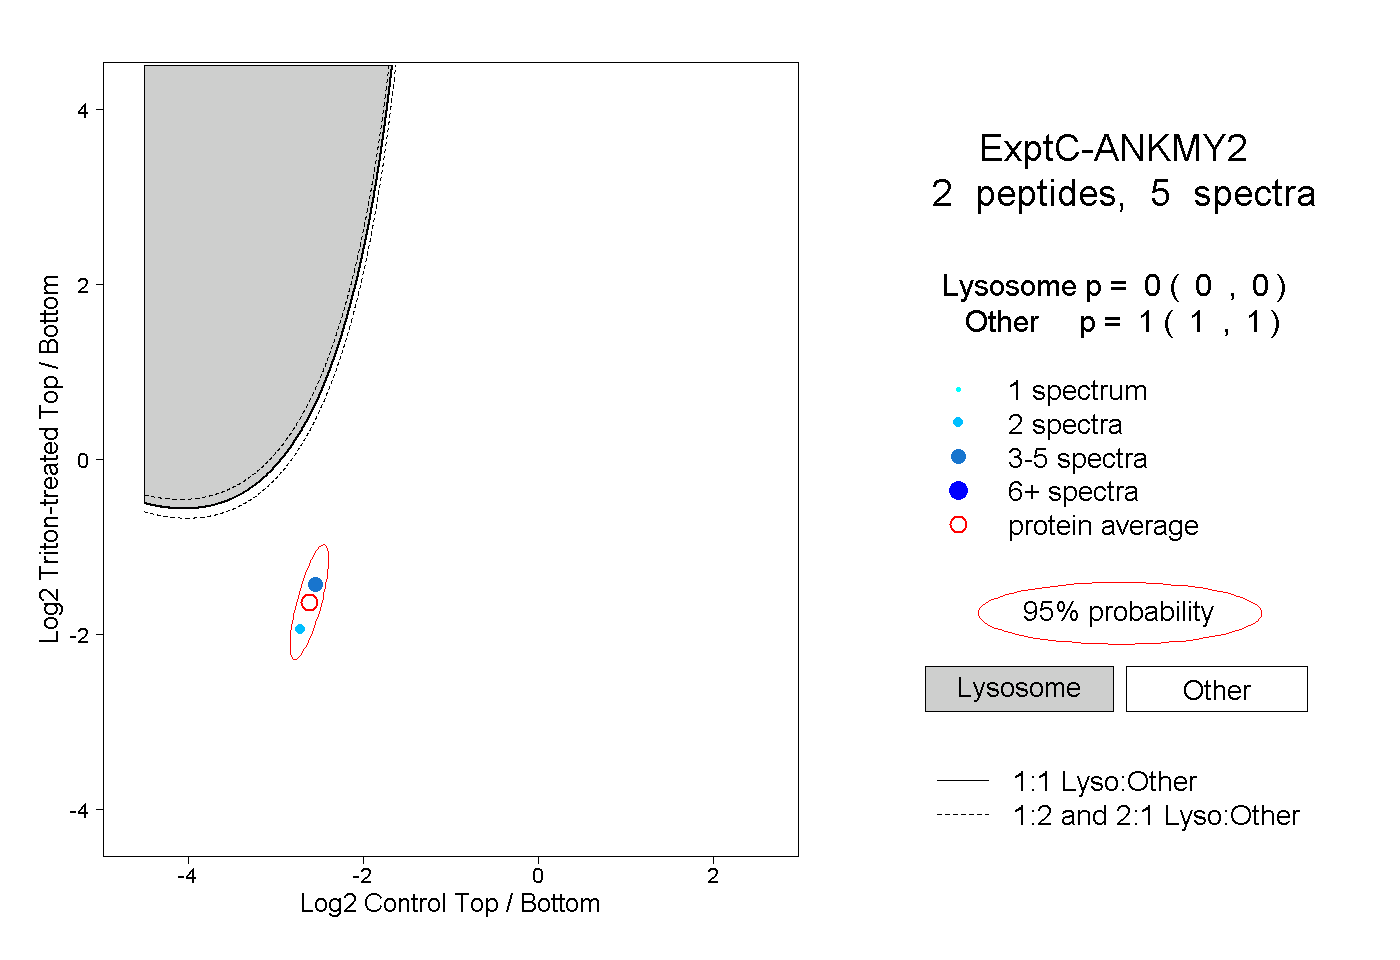 |
0.000 0.000 | 0.000 |
1.000 1.000 | 1.000 |