 4
4peptides
spectra
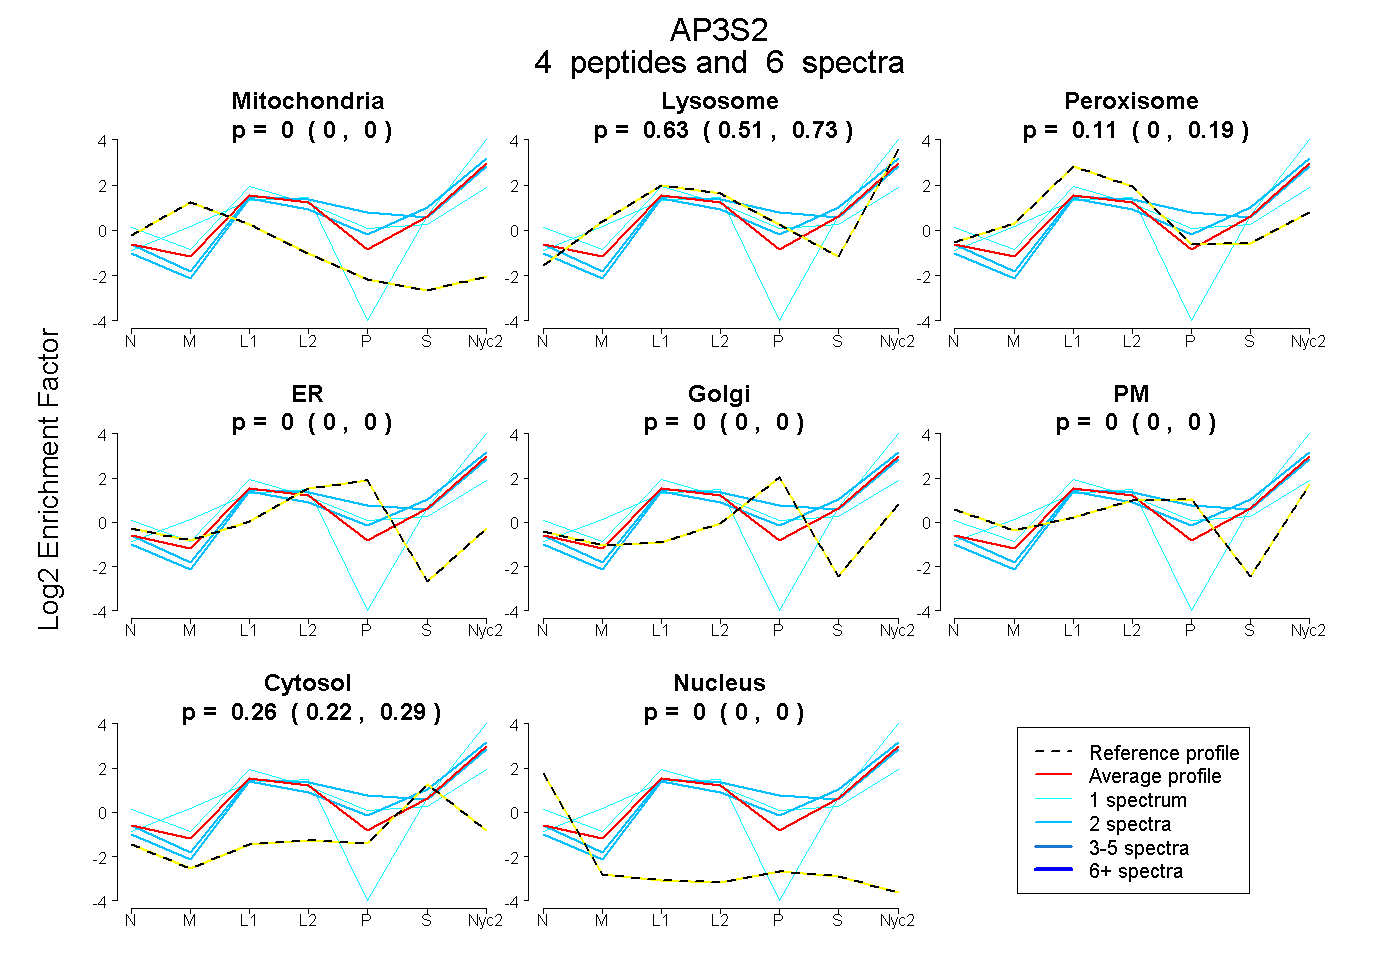
0.000 | 0.000
0.515 | 0.729
0.000 | 0.194
0.000 | 0.000
0.000 | 0.000
0.000 | 0.000
0.222 | 0.292
0.000 | 0.000
3peptides
spectra
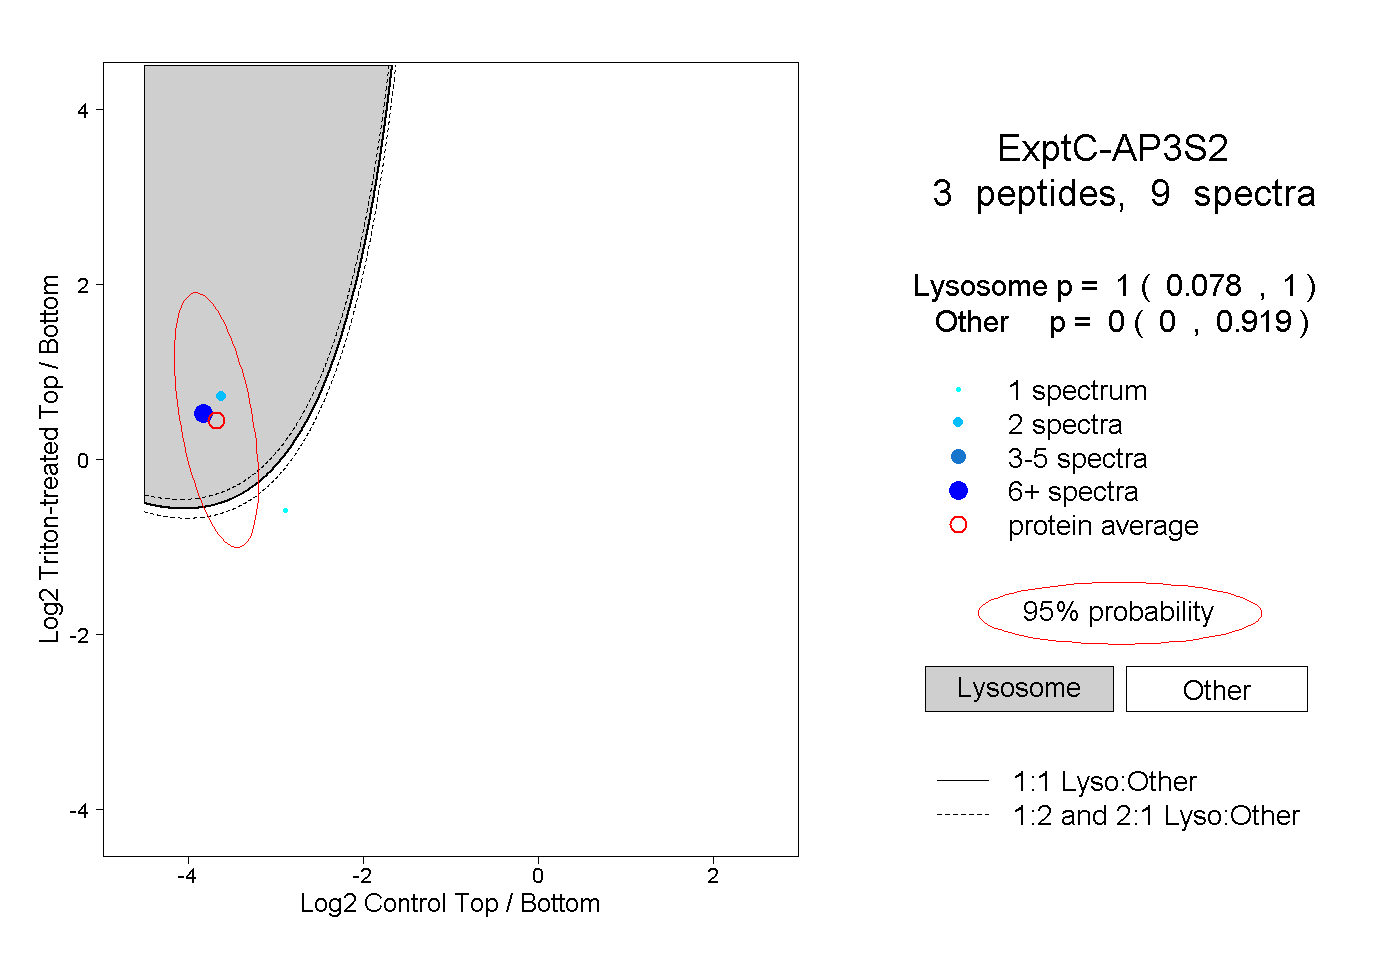
0.078 | 1.000
0.000 | 0.919
1peptide
spectrum
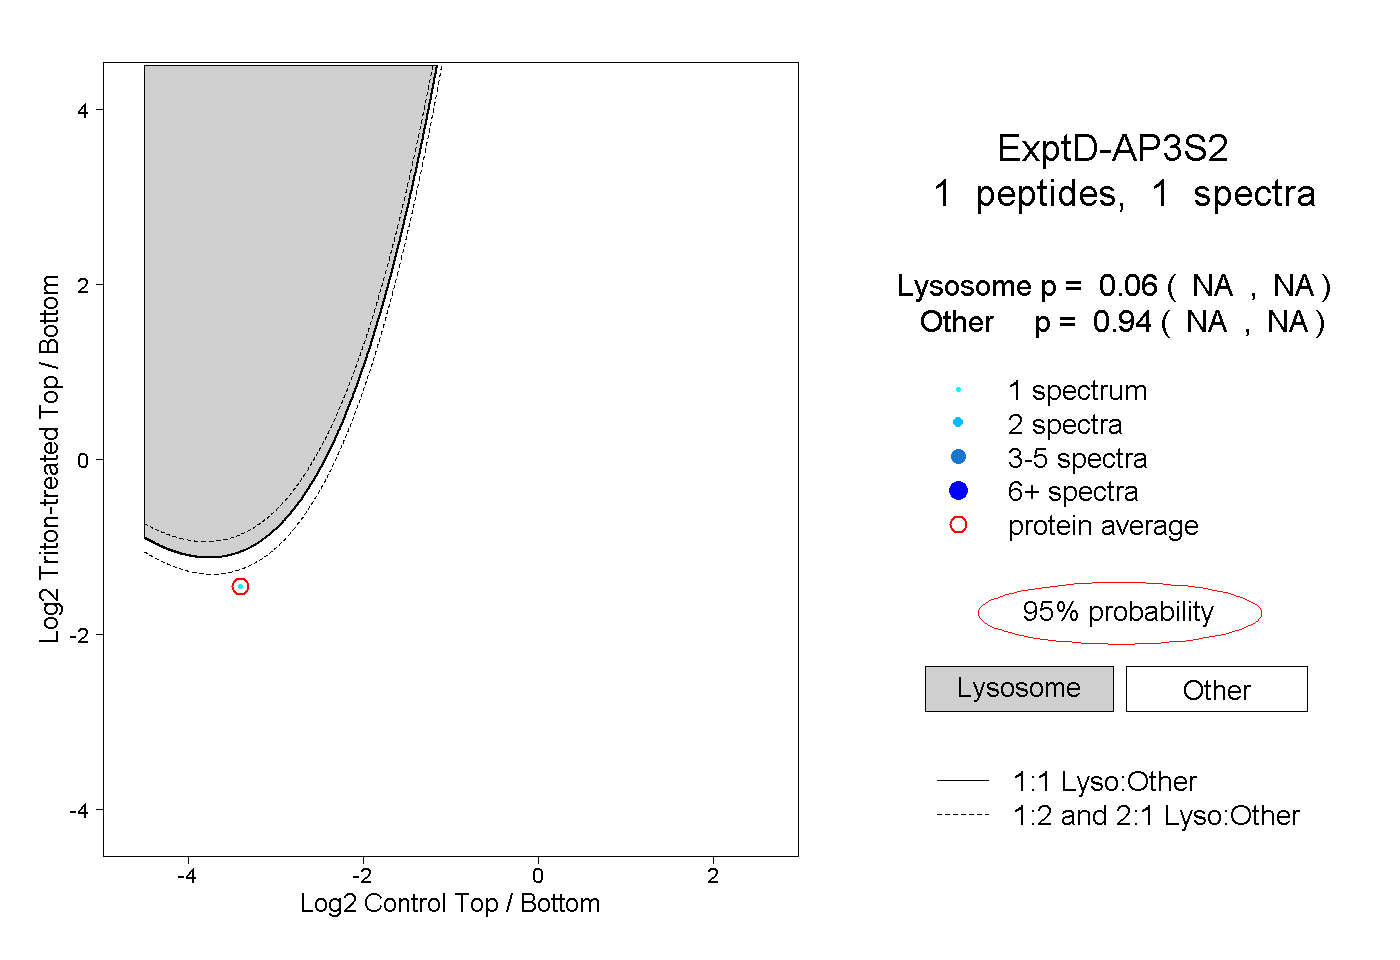
NA | NA
NA | NA