 60
60peptides
spectra
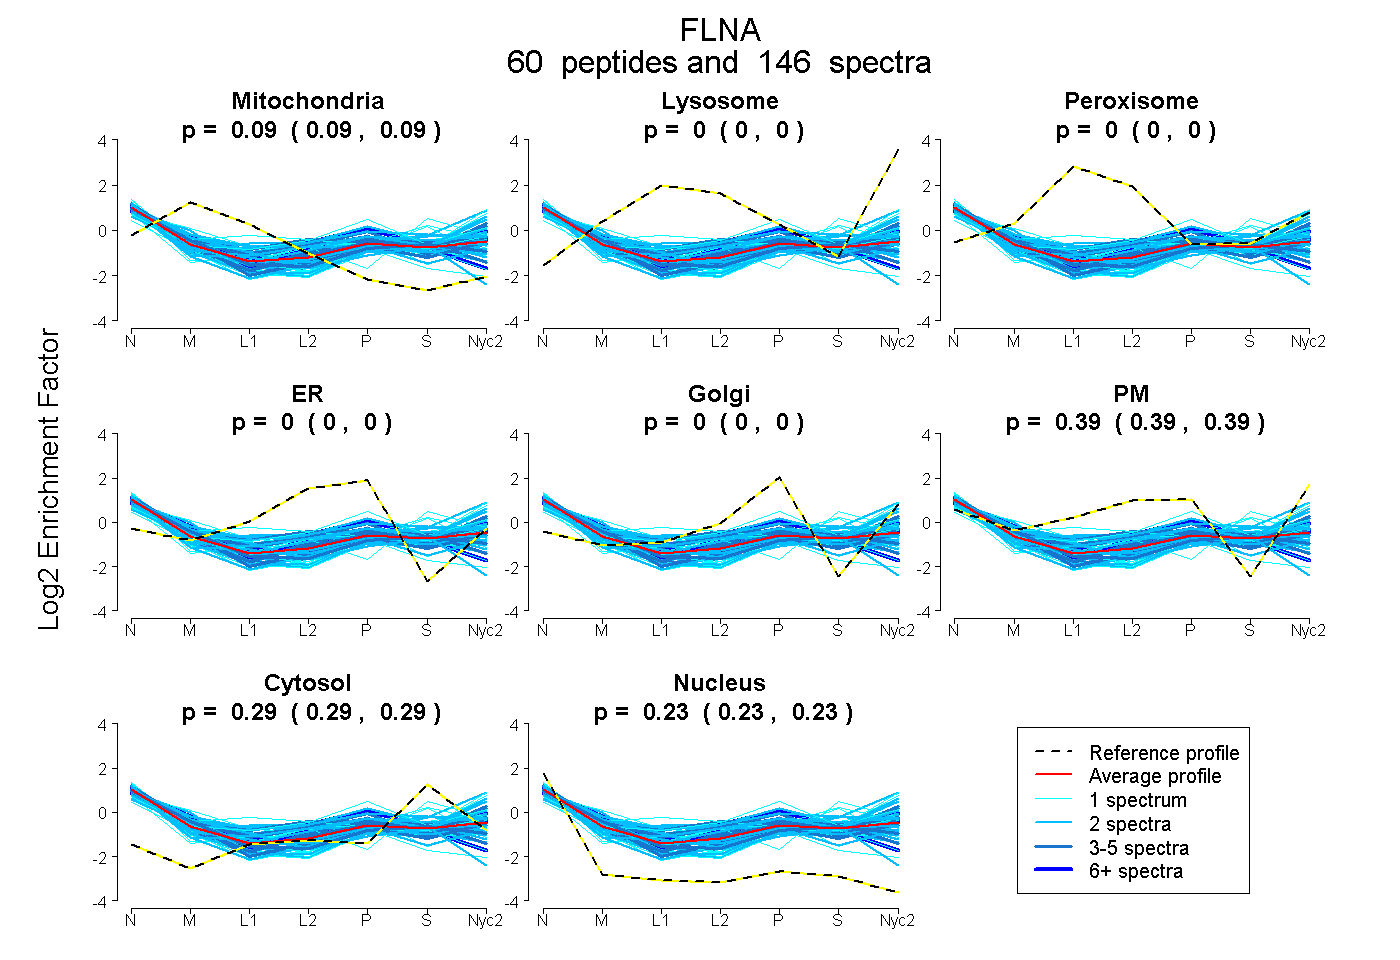
0.085 | 0.089
0.000 | 0.000
0.000 | 0.000
0.000 | 0.000
0.000 | 0.000
0.387 | 0.391
0.291 | 0.294
0.230 | 0.232
10peptides
spectra
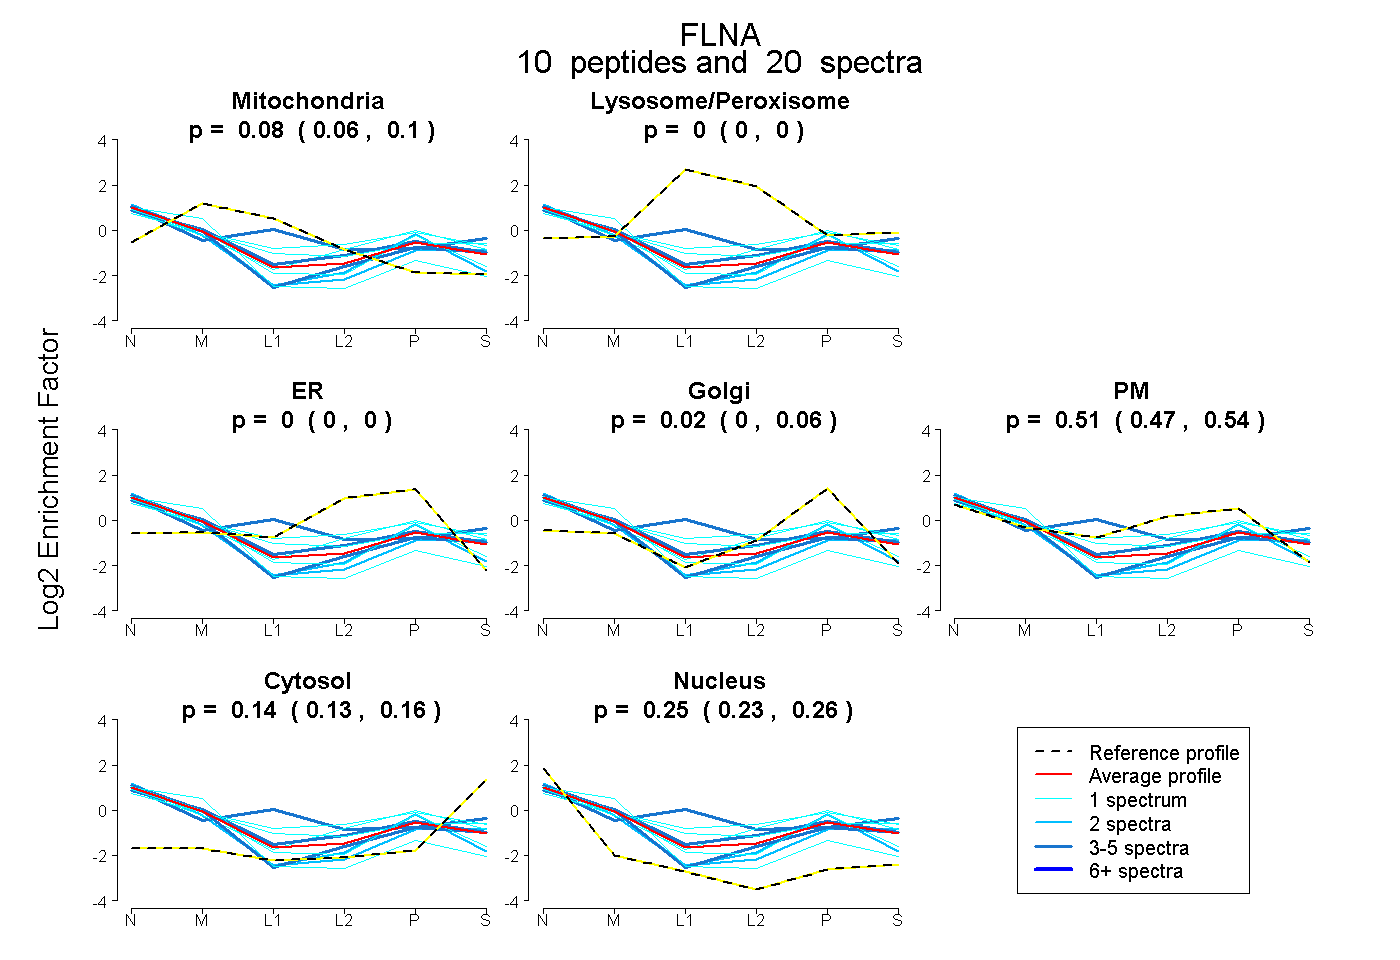
0.056 | 0.096
0.000 | 0.000
0.000 | 0.000
0.000 | 0.056
0.466 | 0.537
0.128 | 0.159
0.231 | 0.258
46peptides
spectra
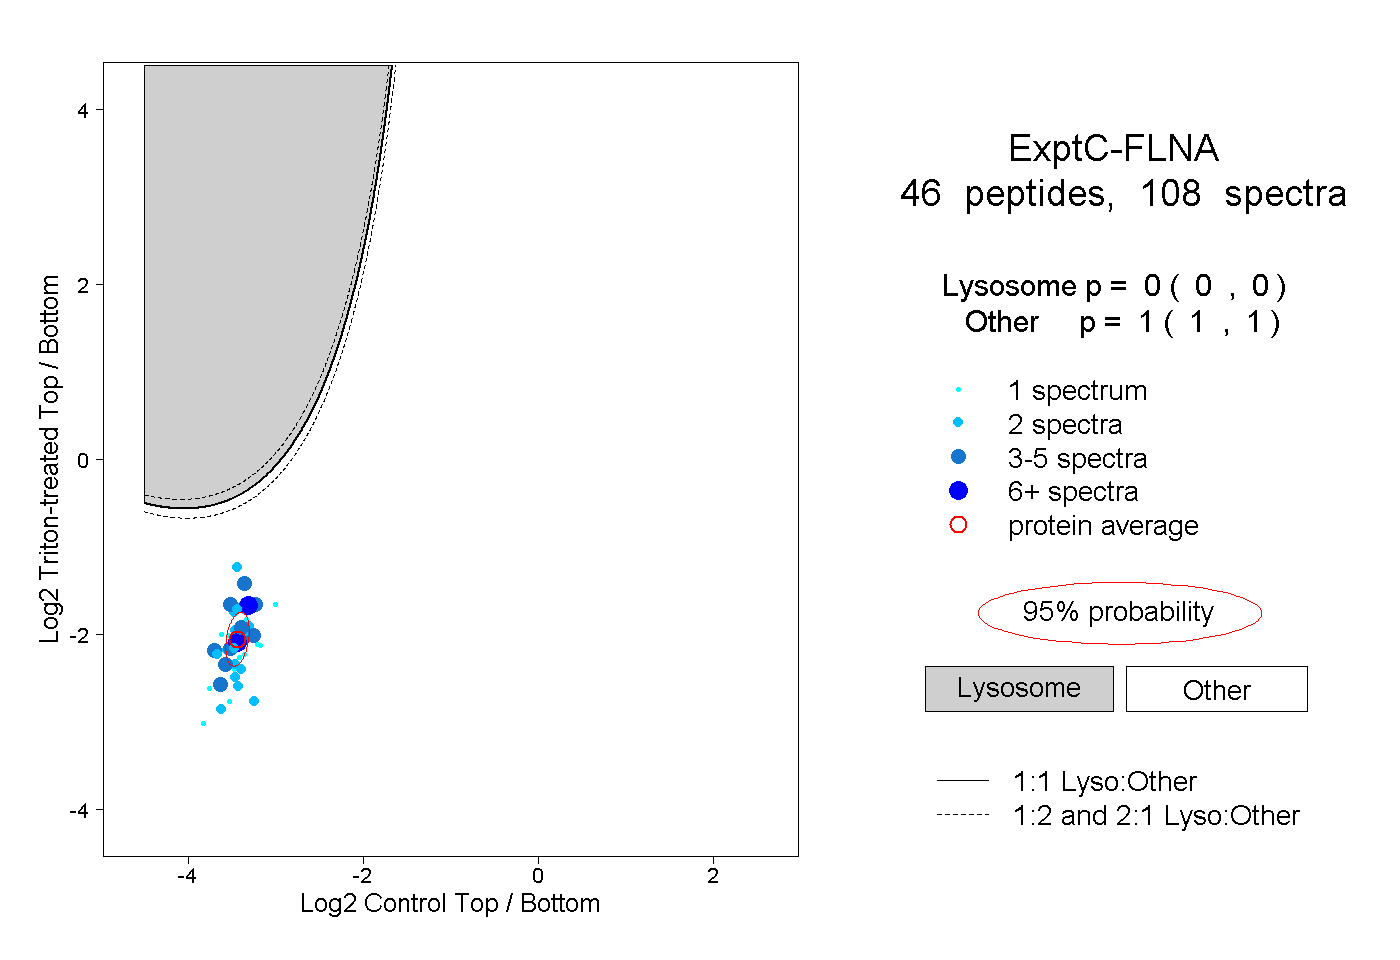
0.000 | 0.000
1.000 | 1.000
7peptides
spectra
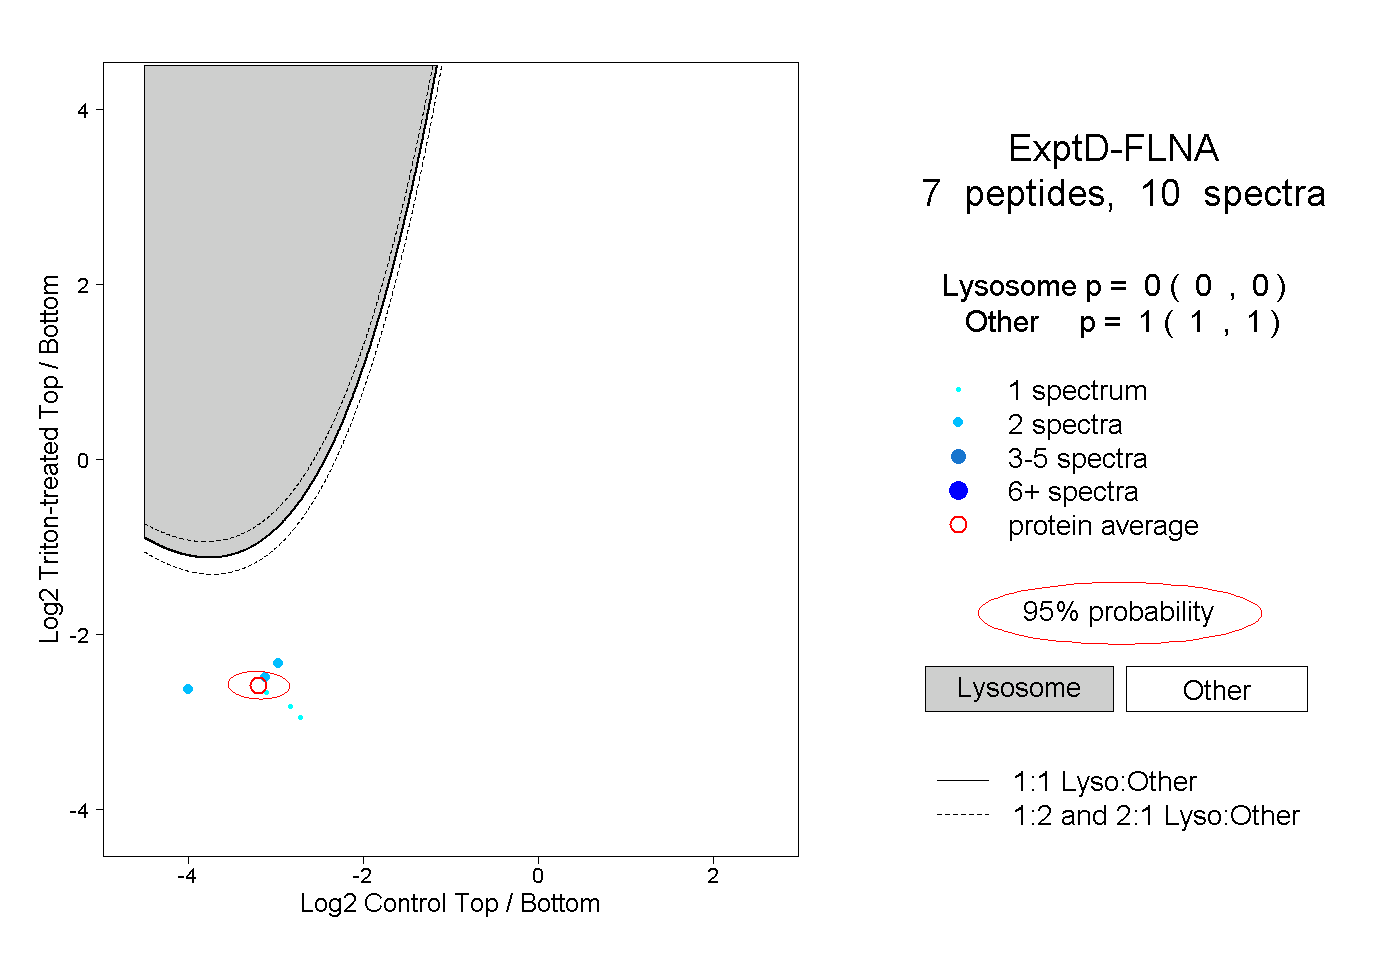
0.000 | 0.000
1.000 | 1.000