 9
9peptides
spectra
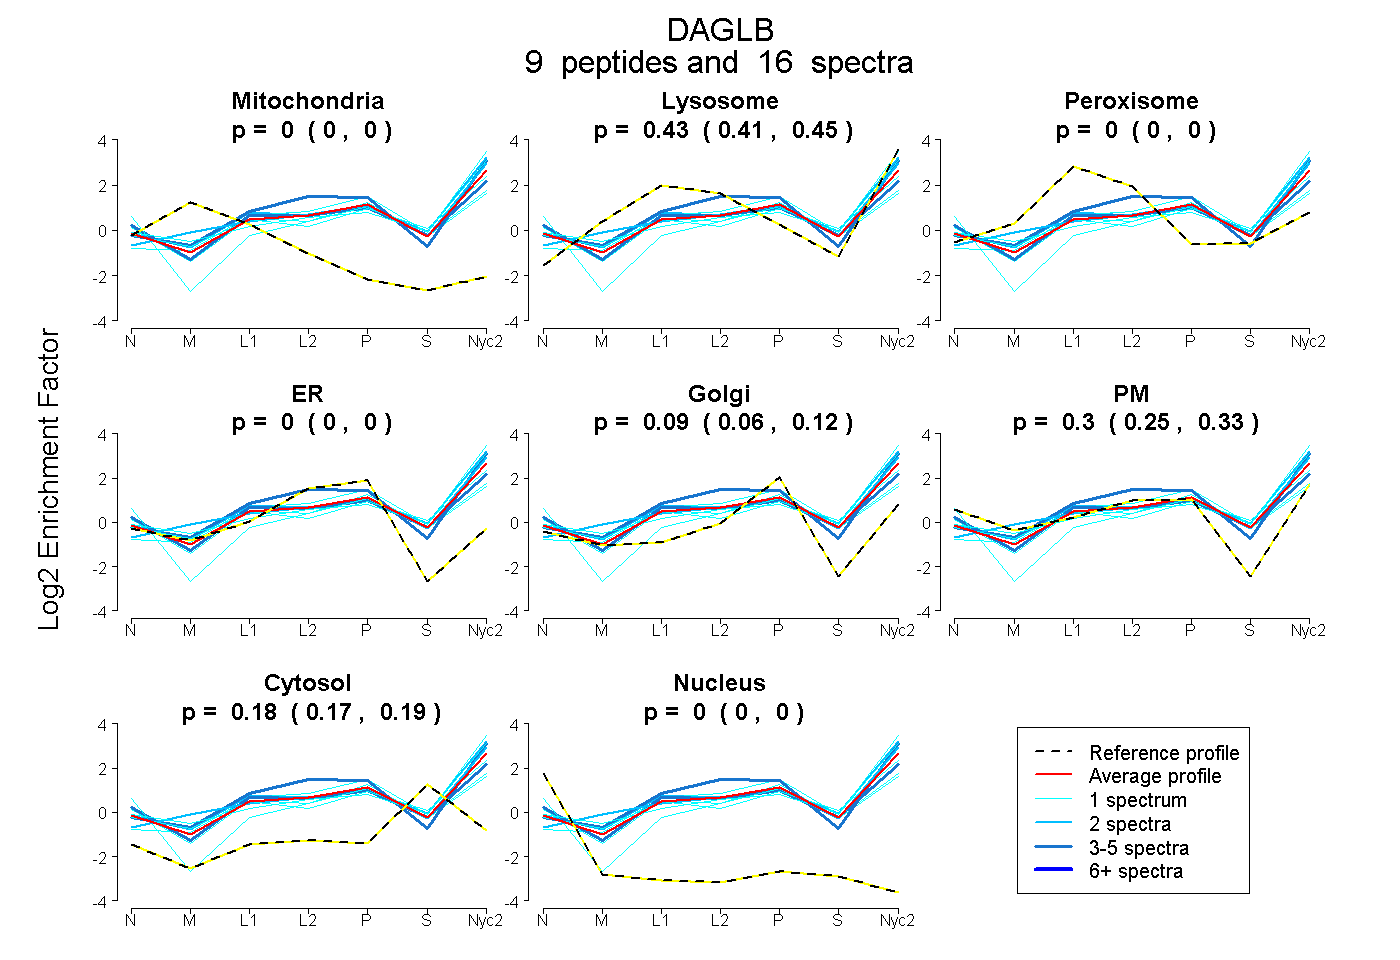
0.000 | 0.000
0.408 | 0.450
0.000 | 0.000
0.000 | 0.000
0.060 | 0.115
0.254 | 0.330
0.172 | 0.191
0.000 | 0.000
8peptides
spectra
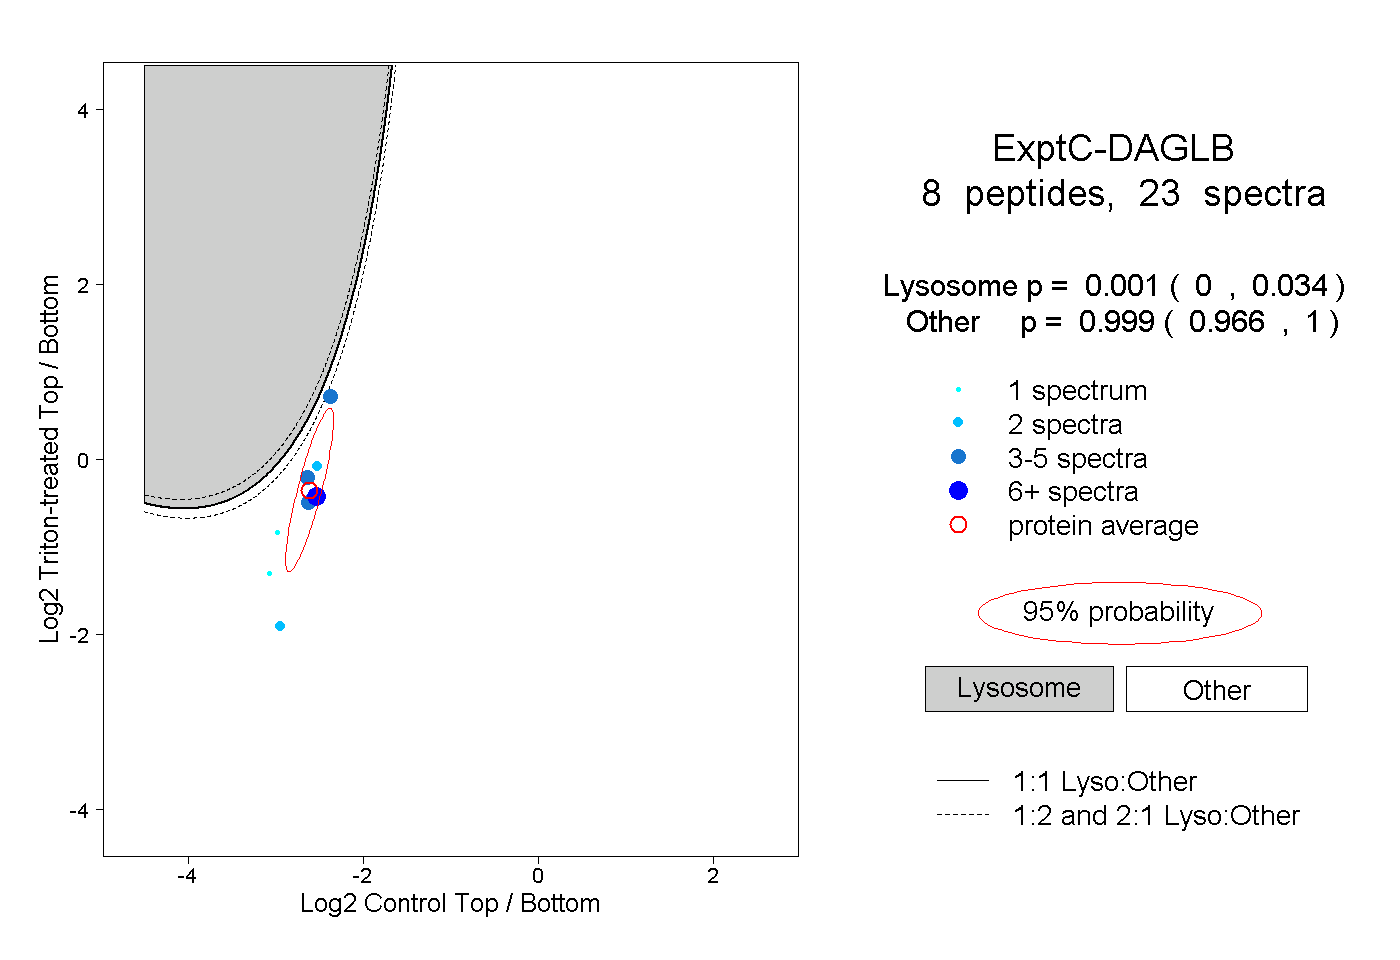
0.000 | 0.034
0.966 | 1.000
2peptides
spectra
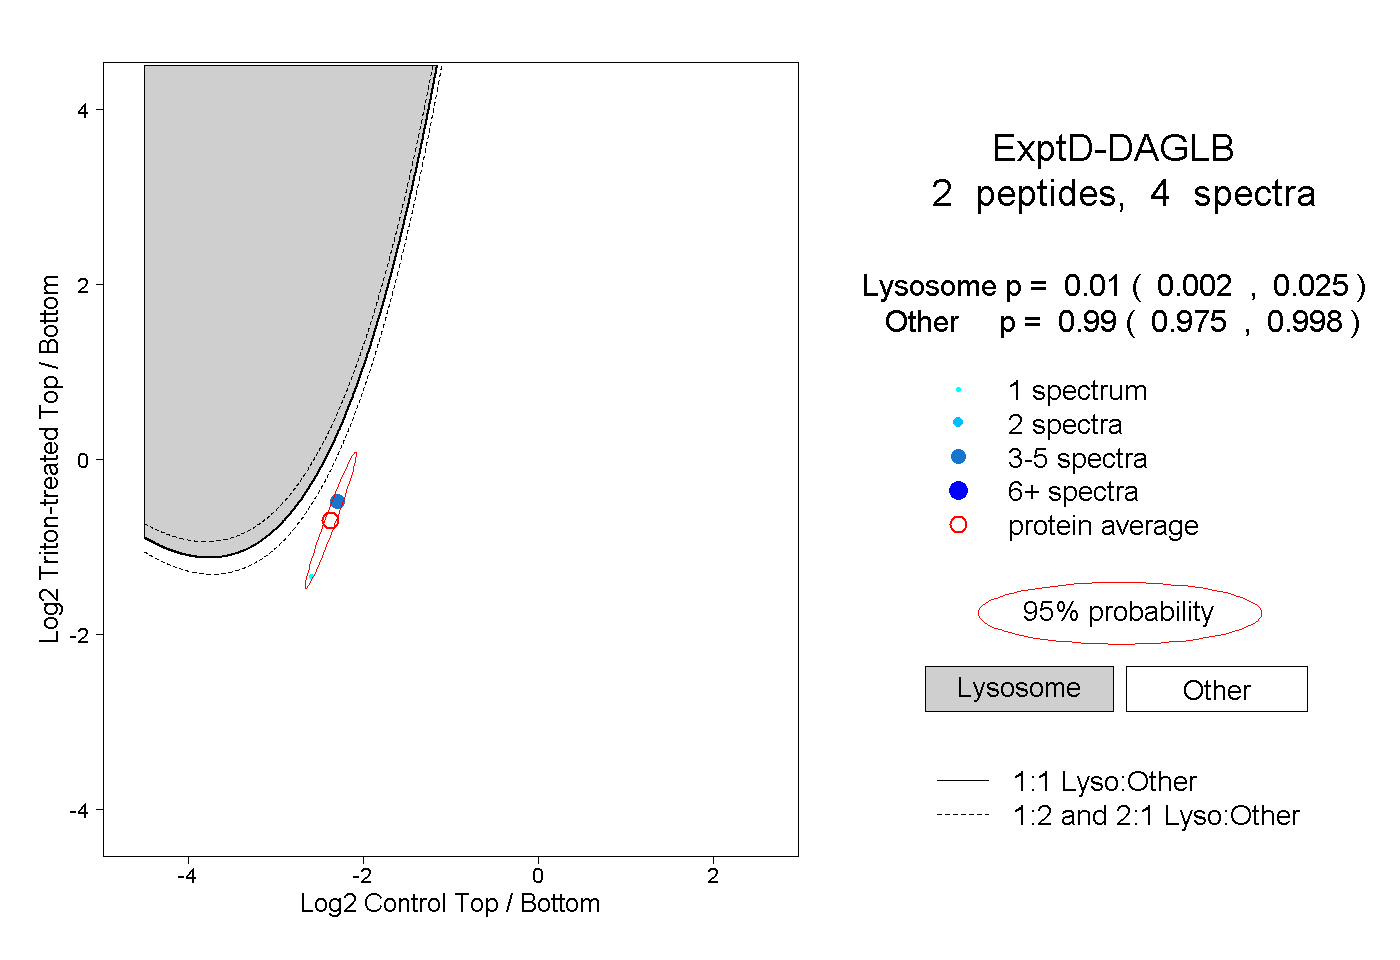
0.002 | 0.025
0.975 | 0.998