 3
3peptides
spectra
0.000 | 0.000
0.104 | 0.175
0.121 | 0.218
0.000 | 0.000
0.107 | 0.338
0.208 | 0.419
0.061 | 0.177
0.000 | 0.000
| Plot | Mito | Lyso | Perox | ER | Golgi | PM | Cytosol | Nucleus | |||||
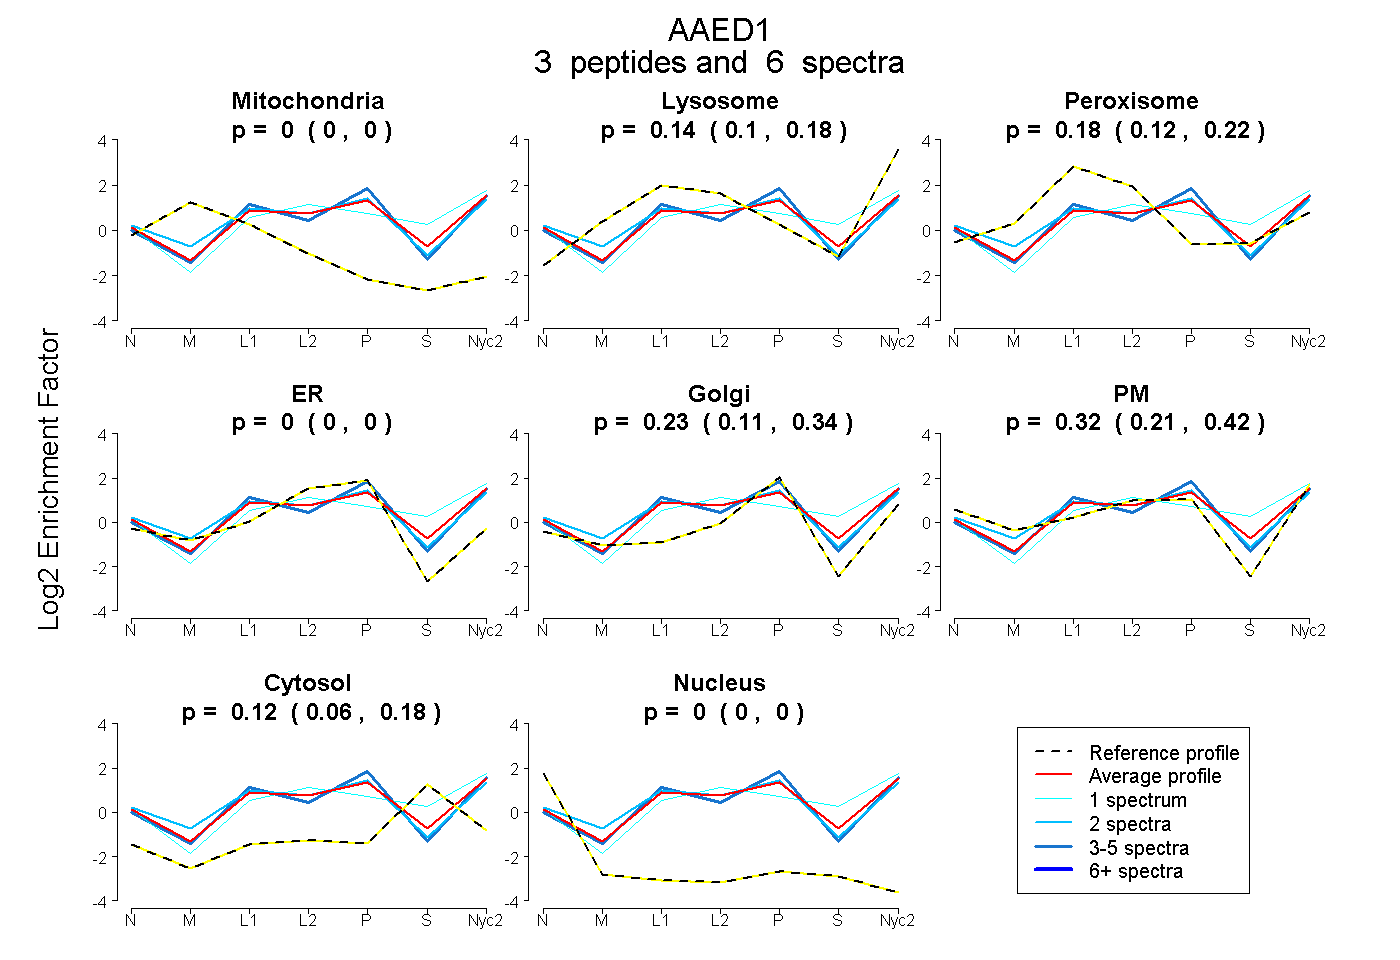
| Expt A |
3 peptides |
6 spectra |
|
0.000 0.000 | 0.000 |
0.142 0.104 | 0.175 |
0.176 0.121 | 0.218 |
0.000 0.000 | 0.000 |
0.233 0.107 | 0.338 |
0.324 0.208 | 0.419 |
0.124 0.061 | 0.177 |
0.000 0.000 | 0.000 |
| 2 spectra, VTFGALFR | 0.000 | 0.044 | 0.297 | 0.000 | 0.347 | 0.294 | 0.017 | 0.000 | ||
| 1 spectrum, VPSPTGSDTER | 0.000 | 0.245 | 0.077 | 0.000 | 0.000 | 0.365 | 0.312 | 0.000 | ||
| 3 spectra, QVSGCAGR | 0.000 | 0.138 | 0.222 | 0.000 | 0.569 | 0.071 | 0.000 | 0.000 |
| Plot | Lyso | Other | |||||||||||
| Expt C |
2 peptides |
2 spectra |
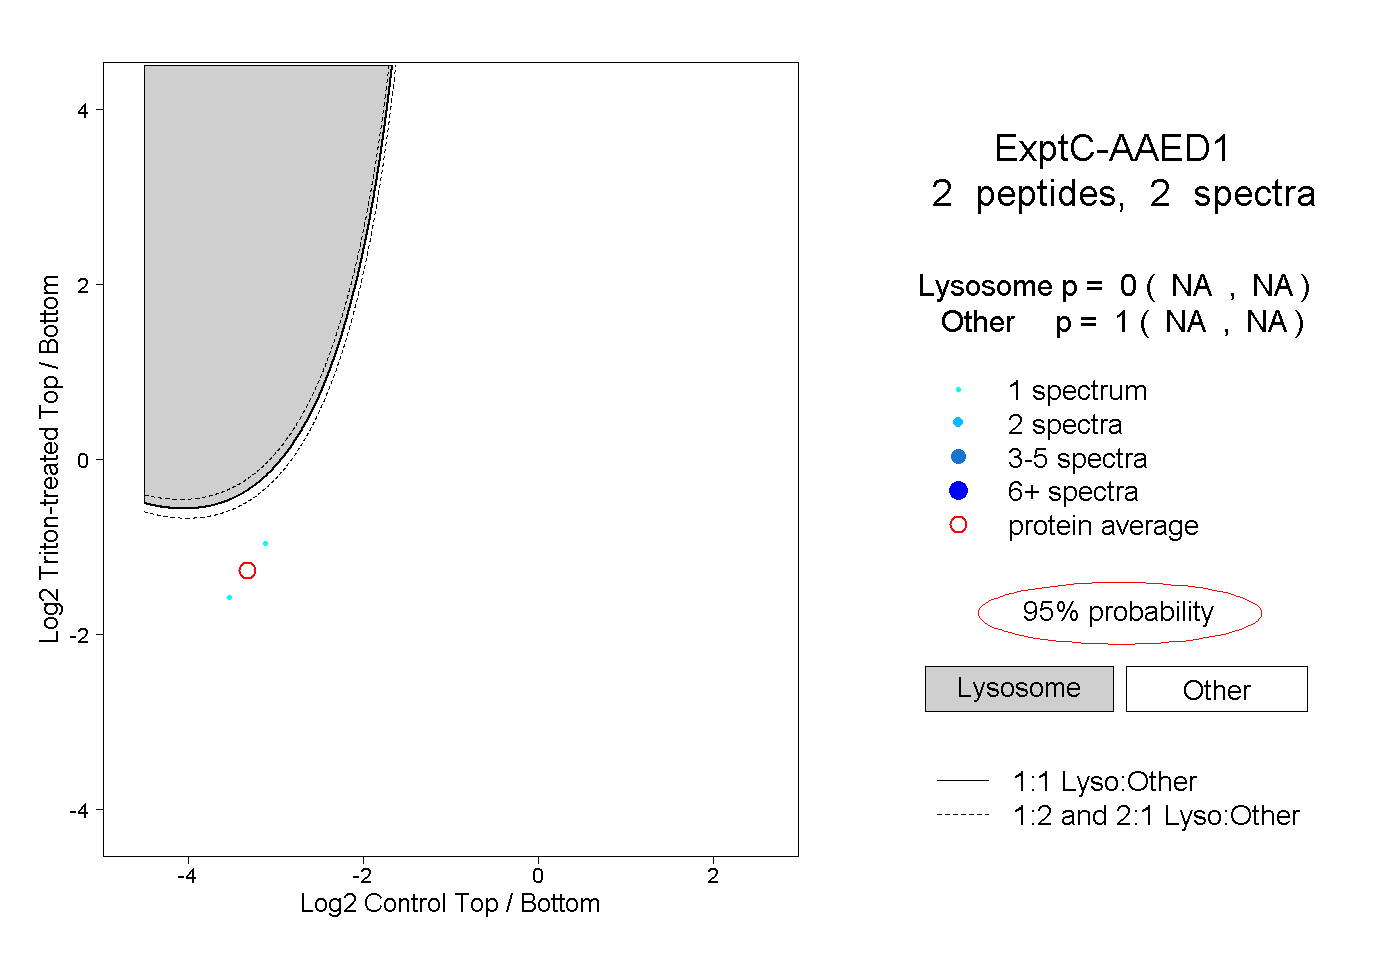 |
0.000 NA | NA |
1.000 NA | NA |