 3
3peptides
spectra
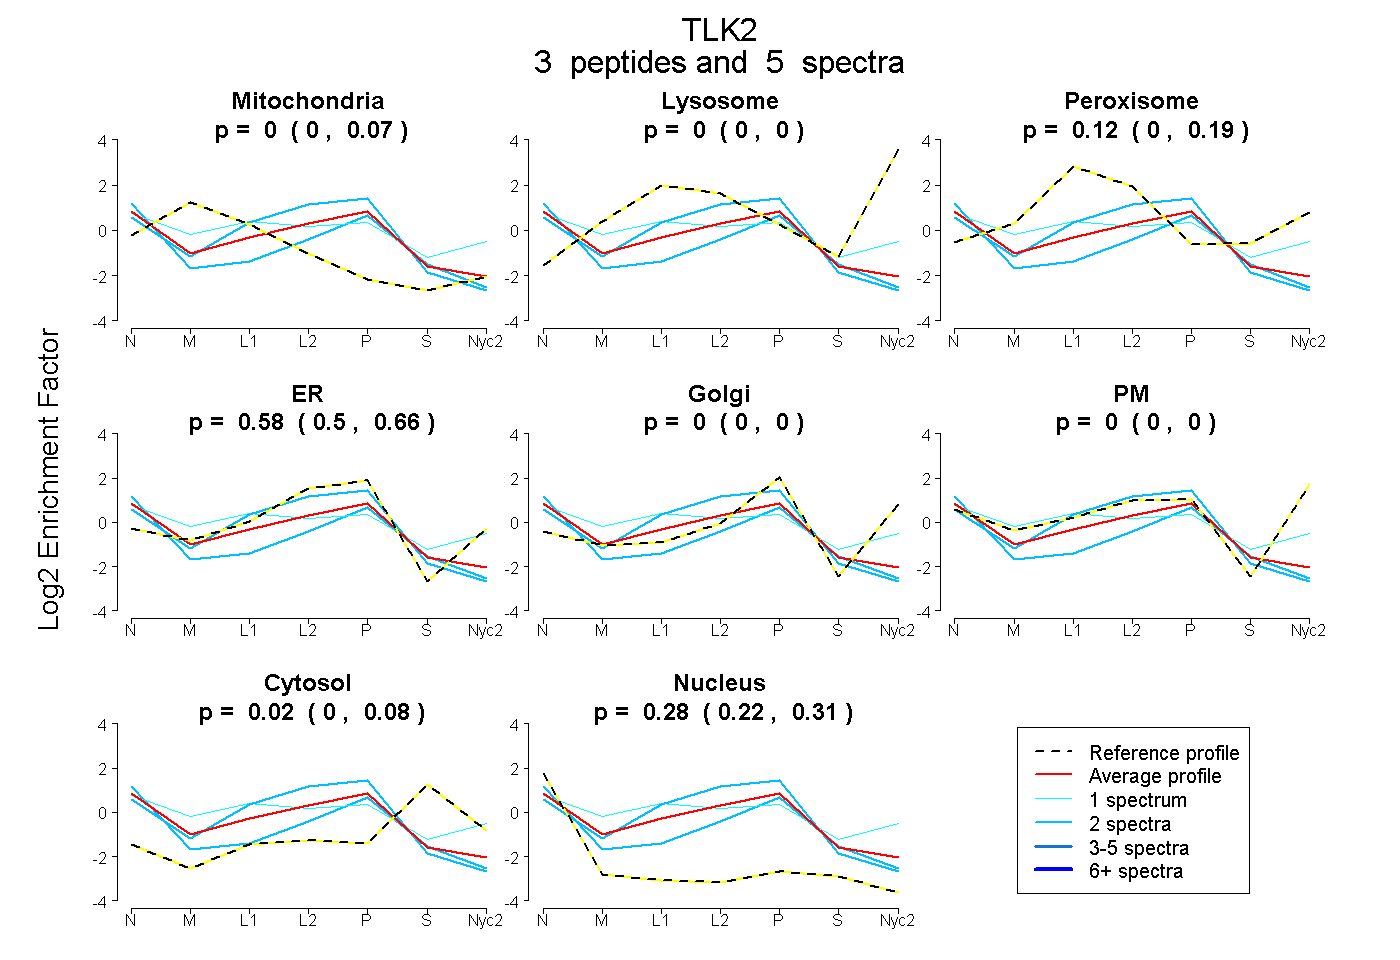
0.000 | 0.071
0.000 | 0.000
0.000 | 0.194
0.499 | 0.656
0.000 | 0.000
0.000 | 0.000
0.000 | 0.082
0.215 | 0.308
| Plot | Mito | Lyso | Perox | ER | Golgi | PM | Cytosol | Nucleus | |||||
| Expt A |
3 peptides |
5 spectra |
|
0.000 0.000 | 0.071 |
0.000 0.000 | 0.000 |
0.117 0.000 | 0.194 |
0.581 0.499 | 0.656 |
0.000 0.000 | 0.000 |
0.000 0.000 | 0.000 |
0.023 0.000 | 0.082 |
0.278 0.215 | 0.308 |
| 2 spectra, QISIQHR | 0.000 | 0.000 | 0.073 | 0.736 | 0.000 | 0.000 | 0.000 | 0.190 | ||
| 1 spectrum, GGFSEVYK | 0.054 | 0.000 | 0.377 | 0.109 | 0.171 | 0.105 | 0.000 | 0.183 | ||
| 2 spectra, AFDLTEQR | 0.000 | 0.000 | 0.000 | 0.523 | 0.000 | 0.000 | 0.084 | 0.393 |
| Plot | Lyso | Other | |||||||||||
| Expt C |
1 peptide |
1 spectrum |
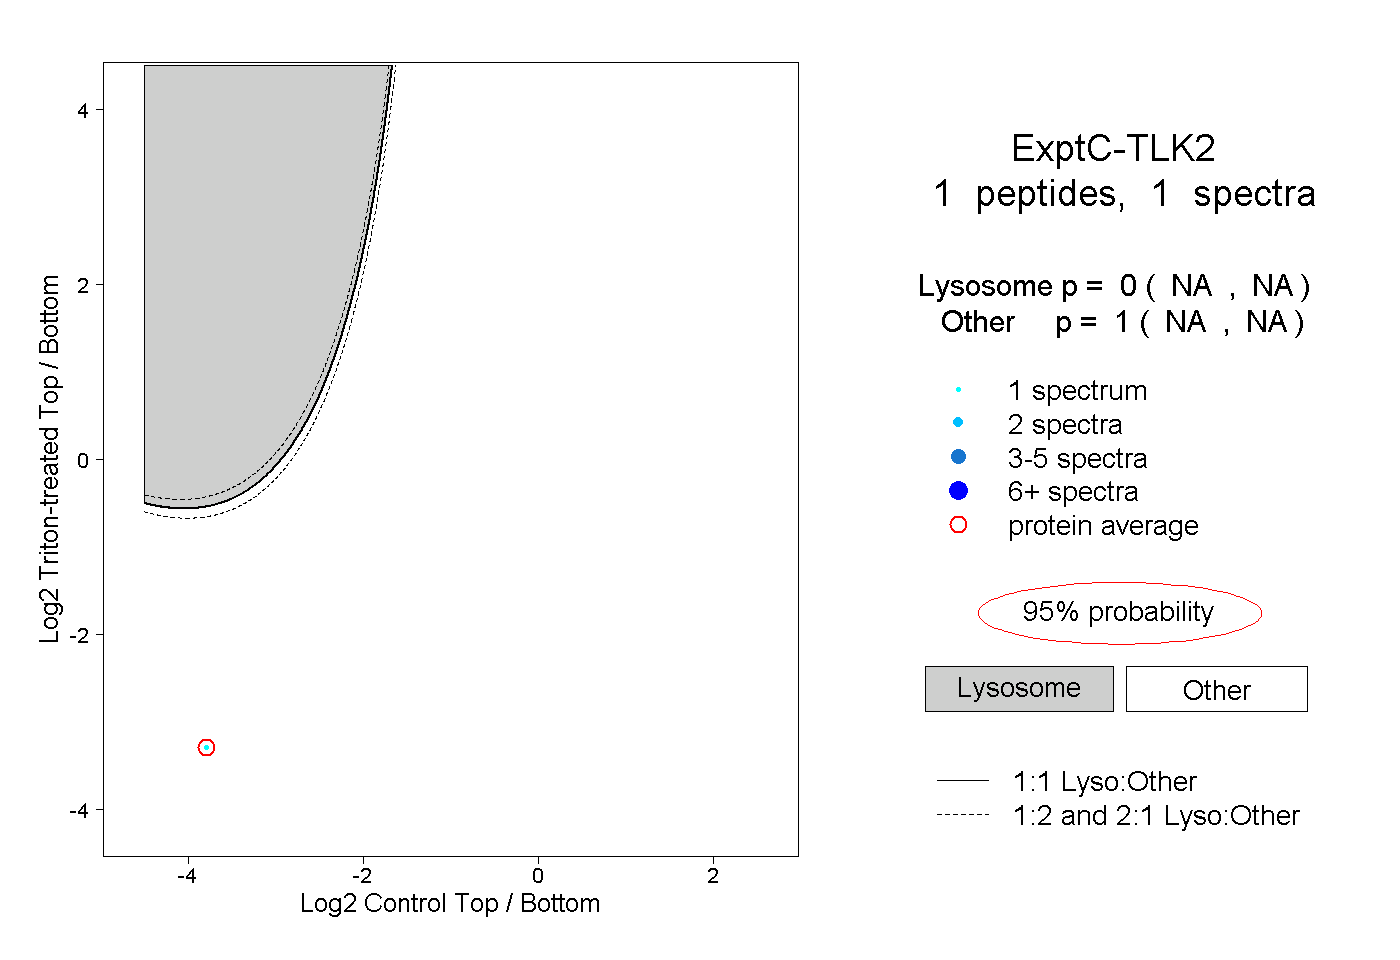 |
0.000 NA | NA |
1.000 NA | NA |