 11
11peptides
spectra
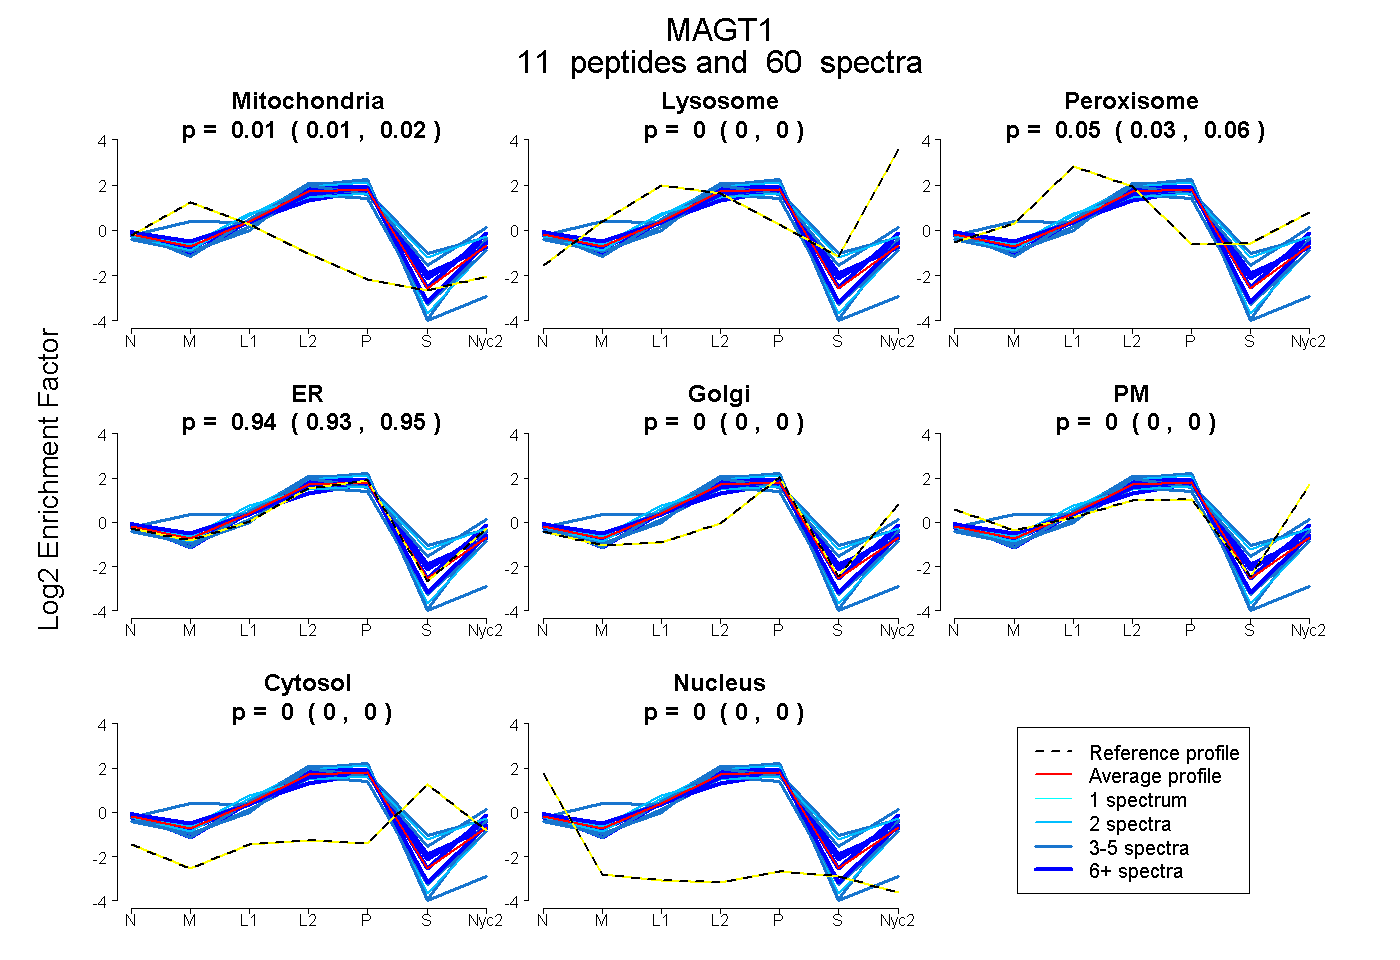
0.005 | 0.019
0.000 | 0.000
0.033 | 0.055
0.934 | 0.949
0.000 | 0.000
0.000 | 0.000
0.000 | 0.000
0.000 | 0.000
7peptides
spectra
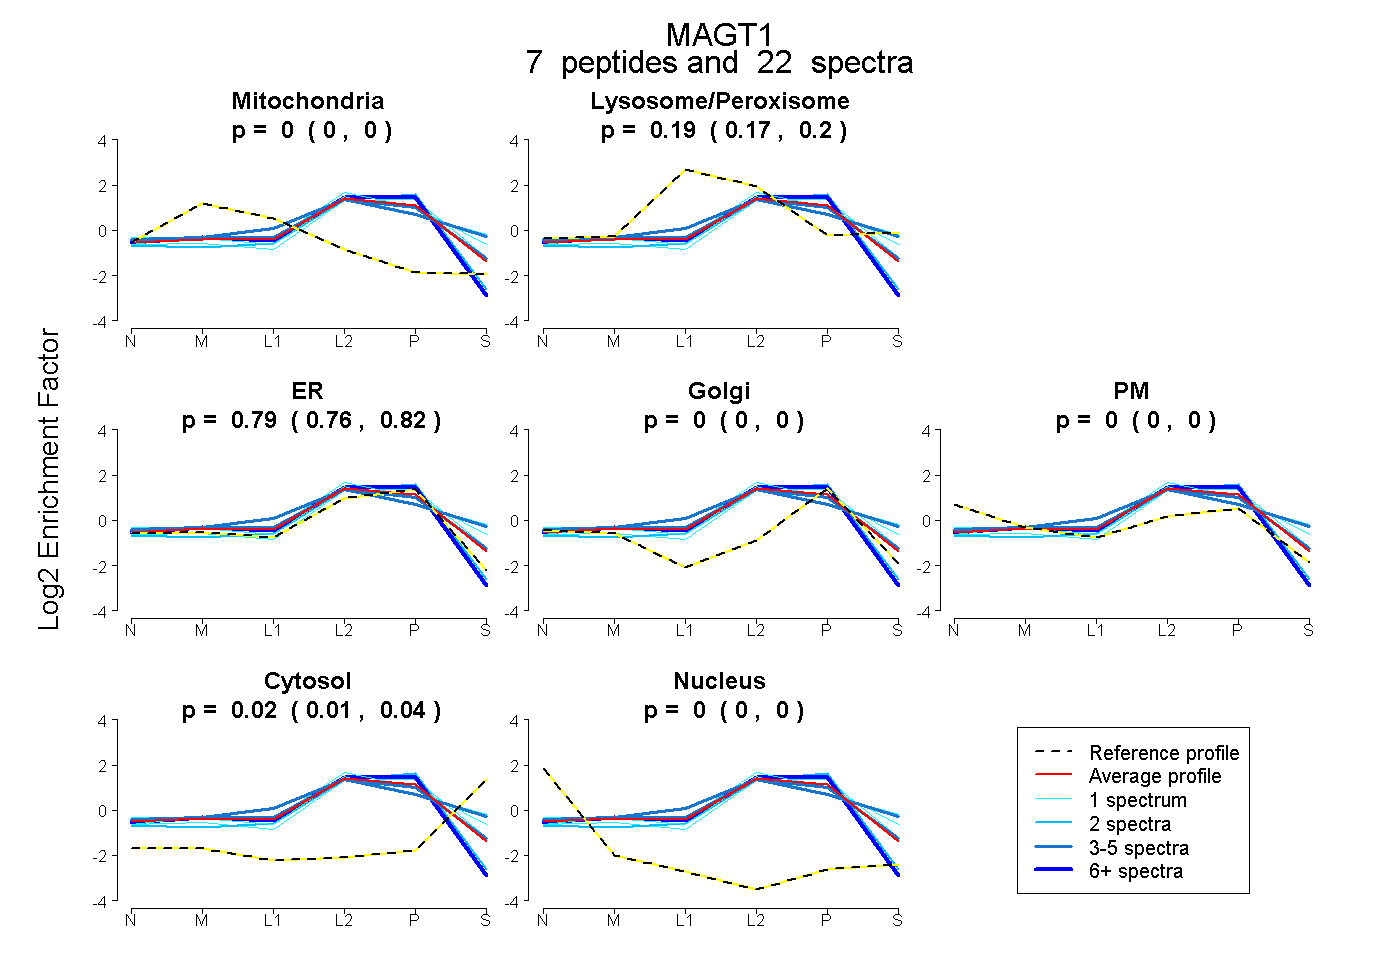
0.000 | 0.000
0.168 | 0.201
0.757 | 0.817
0.000 | 0.000
0.000 | 0.000
0.008 | 0.038
0.000 | 0.000
10peptides
spectra
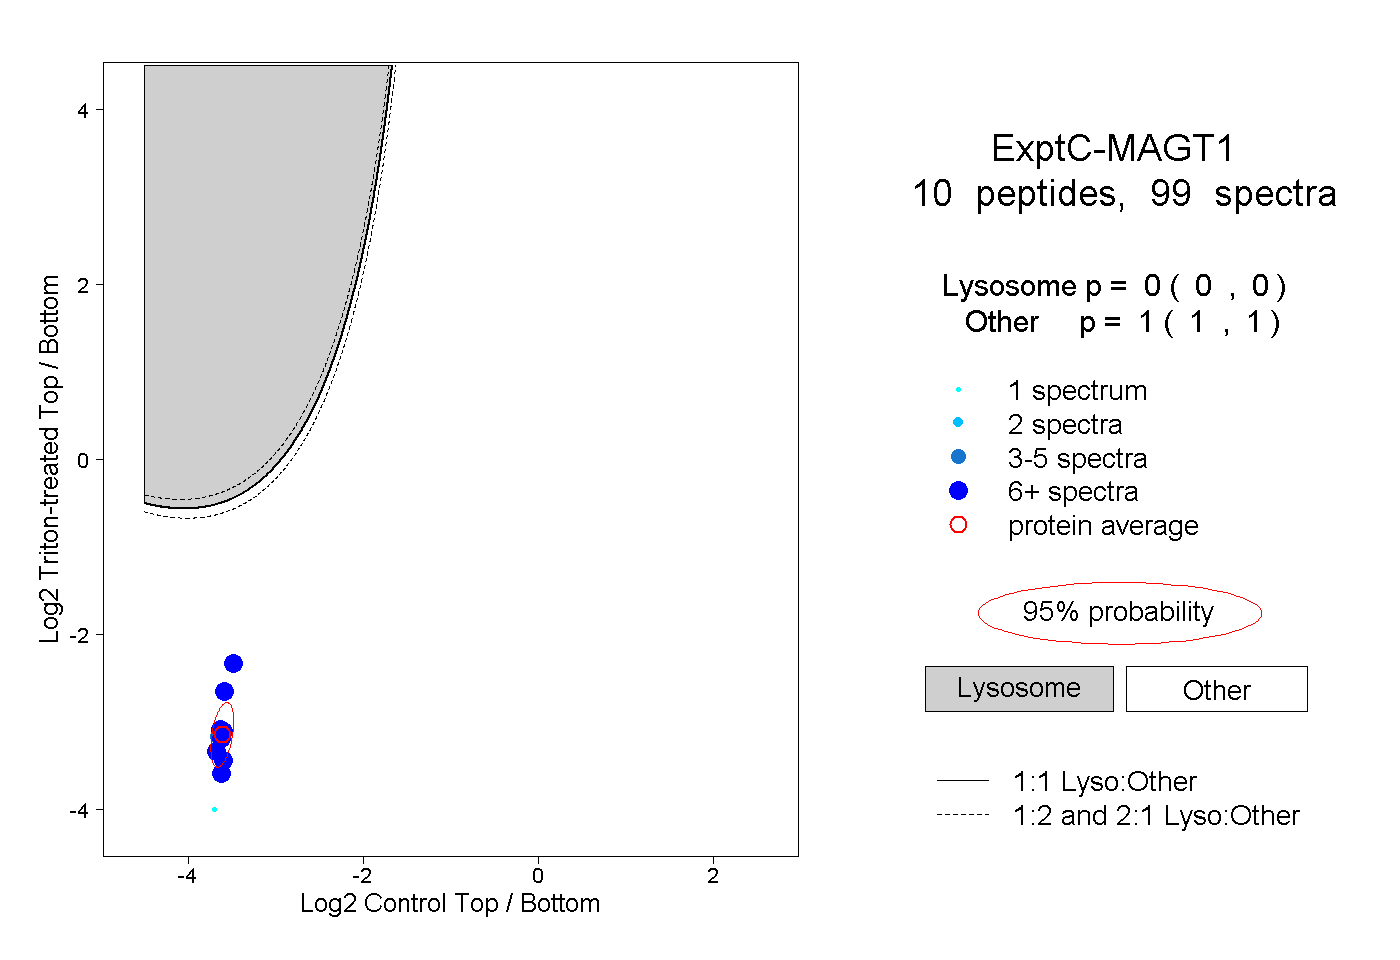
0.000 | 0.000
1.000 | 1.000
7peptides
spectra
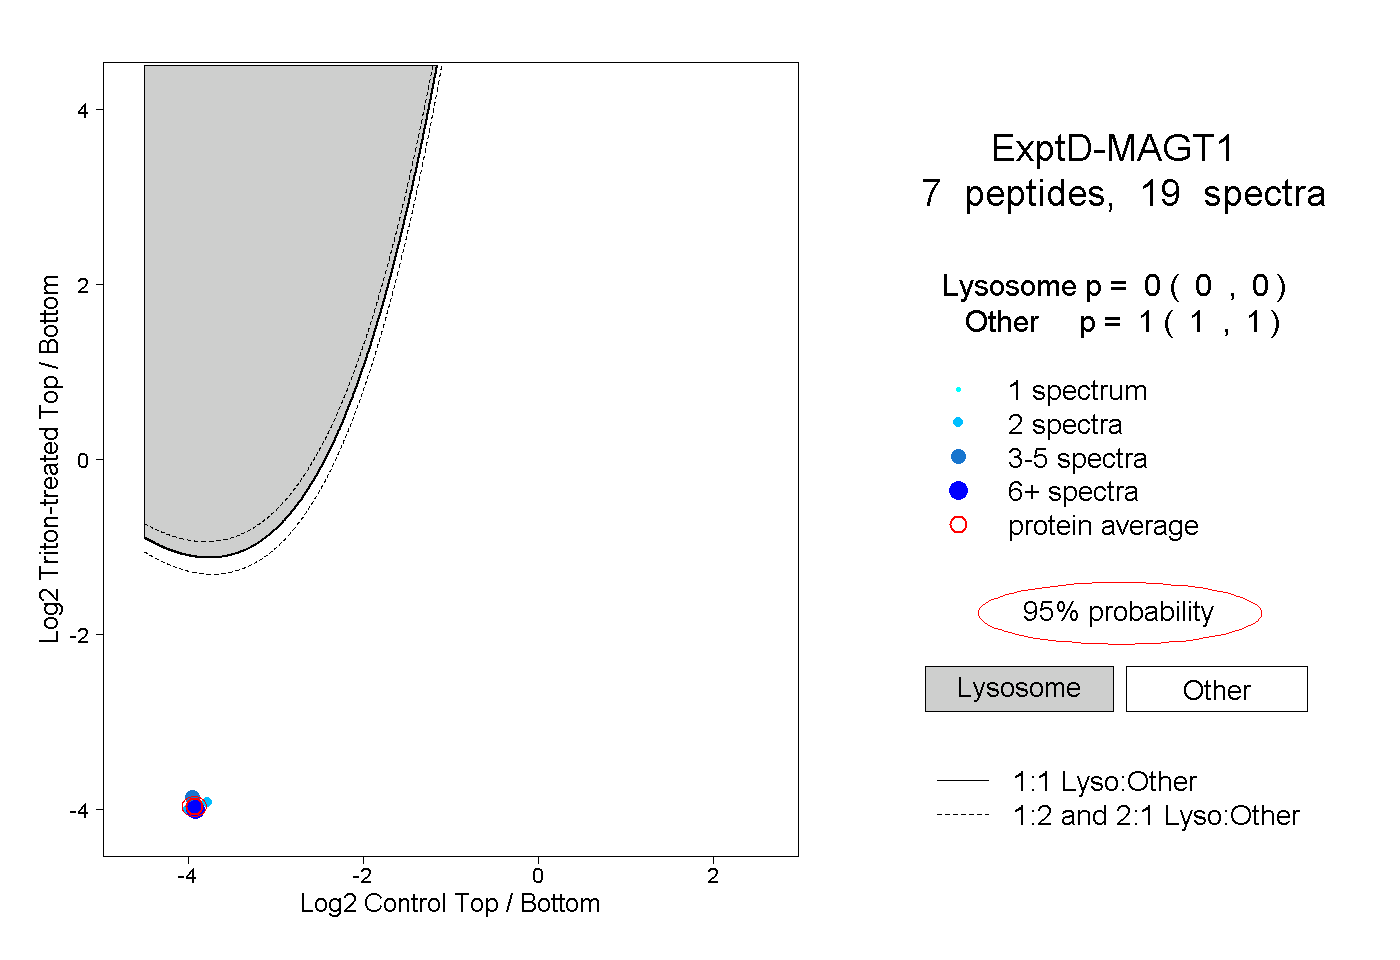
0.000 | 0.000
1.000 | 1.000