 11
11peptides
spectra
0.005 | 0.019
0.000 | 0.000
0.033 | 0.055
0.934 | 0.949
0.000 | 0.000
0.000 | 0.000
0.000 | 0.000
0.000 | 0.000
| Plot | Mito | Lyso | Perox | ER | Golgi | PM | Cytosol | Nucleus | |||||
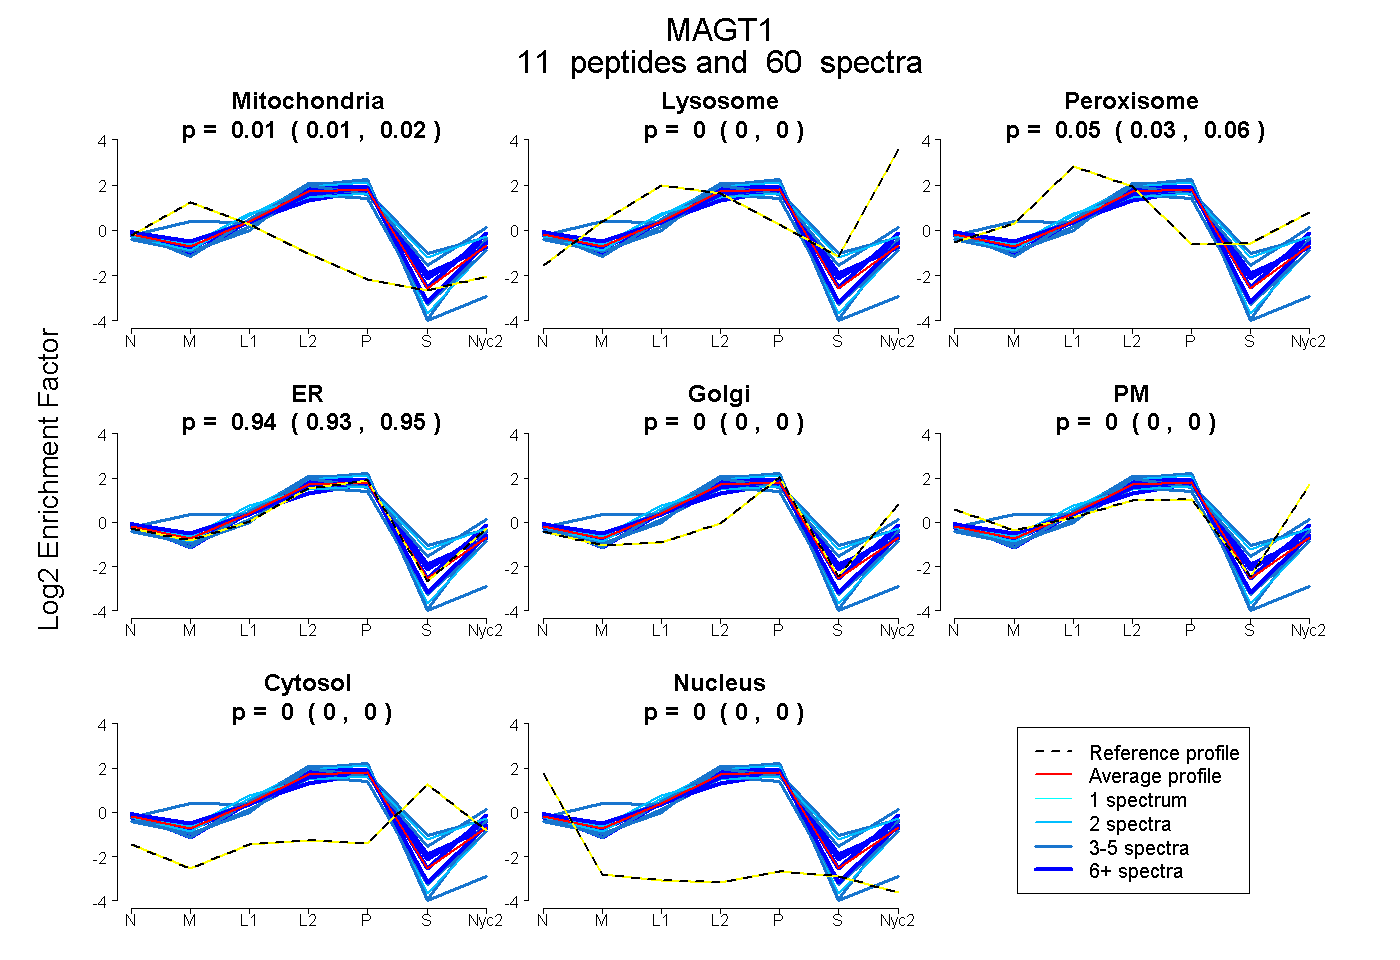
| Expt A |
11 peptides |
60 spectra |
|
0.012 0.005 | 0.019 |
0.000 0.000 | 0.000 |
0.045 0.033 | 0.055 |
0.942 0.934 | 0.949 |
0.000 0.000 | 0.000 |
0.000 0.000 | 0.000 |
0.000 0.000 | 0.000 |
0.000 0.000 | 0.000 |
| 7 spectra, YSSAFTNR | 0.043 | 0.000 | 0.000 | 0.957 | 0.000 | 0.000 | 0.000 | 0.000 | ||
| 4 spectra, ADTYELQVR | 0.000 | 0.000 | 0.116 | 0.733 | 0.000 | 0.000 | 0.151 | 0.000 | ||
| 9 spectra, GFSAEQIAR | 0.000 | 0.000 | 0.107 | 0.891 | 0.000 | 0.000 | 0.002 | 0.000 | ||
| 5 spectra, TDVNIR | 0.181 | 0.000 | 0.000 | 0.819 | 0.000 | 0.000 | 0.000 | 0.000 | ||
| 3 spectra, QADEEFQILANSWR | 0.000 | 0.000 | 0.000 | 1.000 | 0.000 | 0.000 | 0.000 | 0.000 | ||
| 14 spectra, GPPYAHK | 0.000 | 0.000 | 0.084 | 0.845 | 0.000 | 0.000 | 0.059 | 0.012 | ||
| 2 spectra, YHGYPYSFLMS | 0.000 | 0.000 | 0.244 | 0.682 | 0.000 | 0.000 | 0.074 | 0.000 | ||
| 6 spectra, EMVLAEK | 0.000 | 0.000 | 0.059 | 0.941 | 0.000 | 0.000 | 0.000 | 0.000 | ||
| 2 spectra, SNMEFLFNK | 0.000 | 0.000 | 0.000 | 1.000 | 0.000 | 0.000 | 0.000 | 0.000 | ||
| 5 spectra, VSQLMEWTNK | 0.000 | 0.061 | 0.181 | 0.737 | 0.000 | 0.000 | 0.021 | 0.000 | ||
| 3 spectra, QCVVCK | 0.000 | 0.000 | 0.000 | 0.919 | 0.000 | 0.000 | 0.000 | 0.081 |
| Plot | Mito | Lyso or Perox | ER | Golgi | PM | Cytosol | Nucleus | ||||||
| Expt B |
7 peptides |
22 spectra |
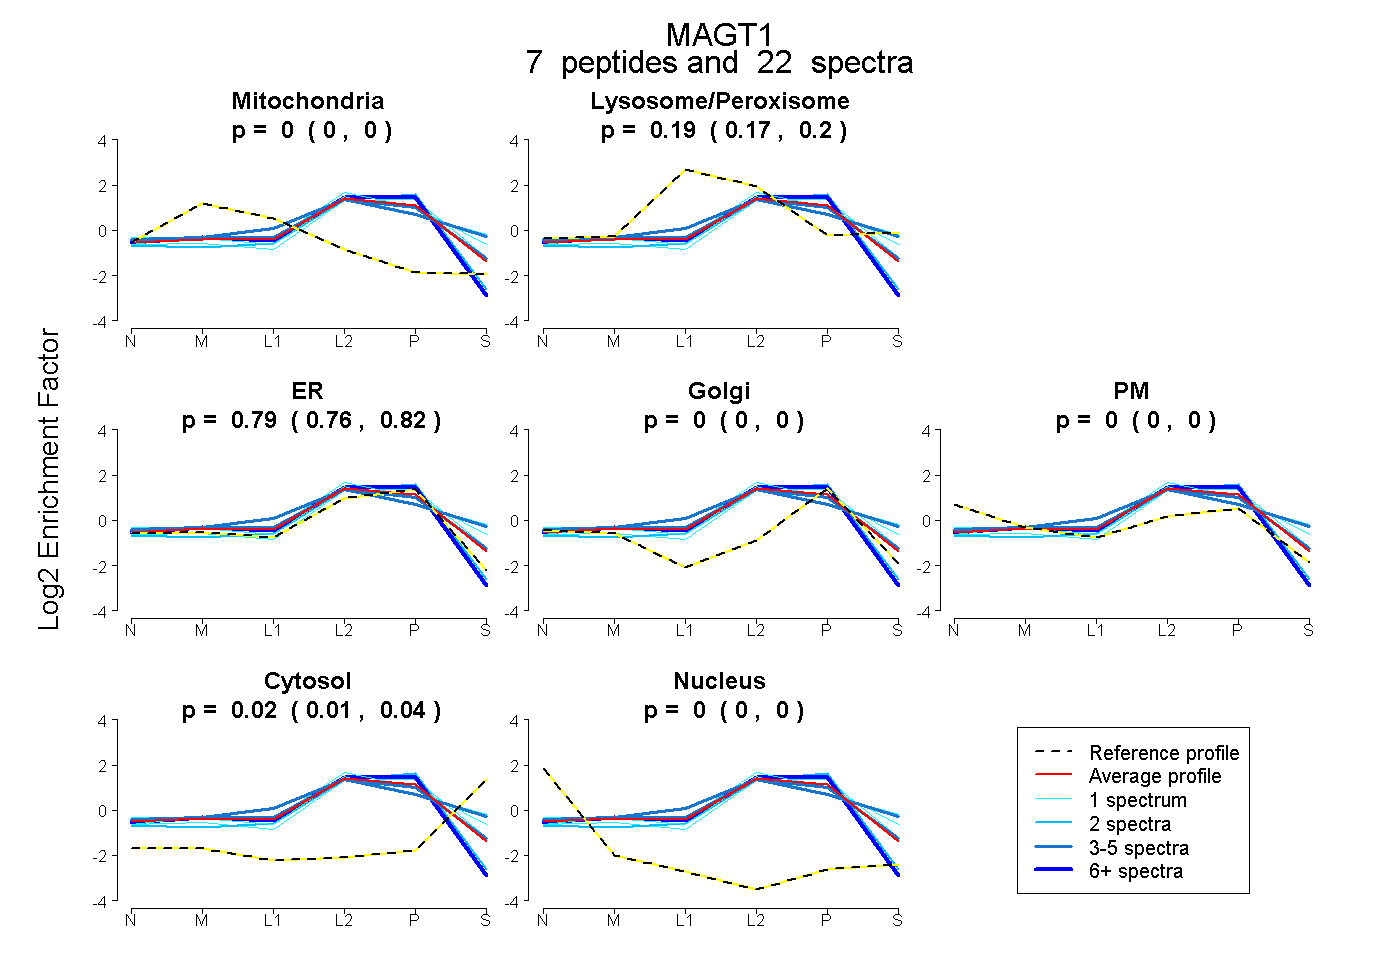 |
0.000 0.000 | 0.000 |
0.186 0.168 | 0.201 |
0.790 0.757 | 0.817 |
0.000 0.000 | 0.000 |
0.000 0.000 | 0.000 |
0.024 0.008 | 0.038 |
0.000 0.000 | 0.000 |
|||
| Plot | Lyso | Other | |||||||||||
| Expt C |
10 peptides |
99 spectra |
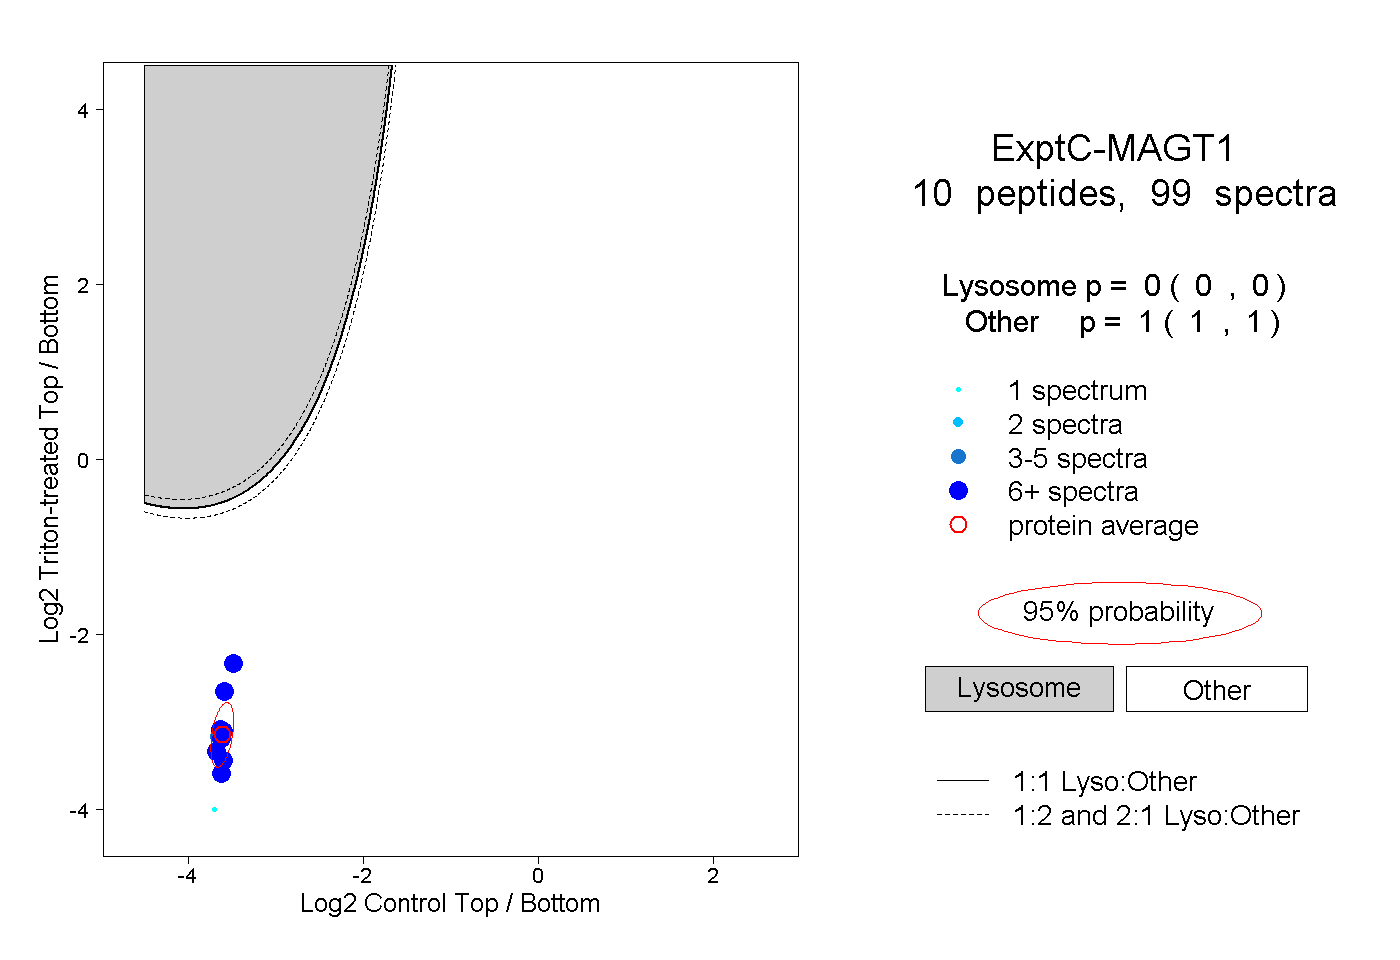 |
0.000 0.000 | 0.000 |
1.000 1.000 | 1.000 |
||||||||
| Plot | Lyso | Other | |||||||||||
| Expt D |
7 peptides |
19 spectra |
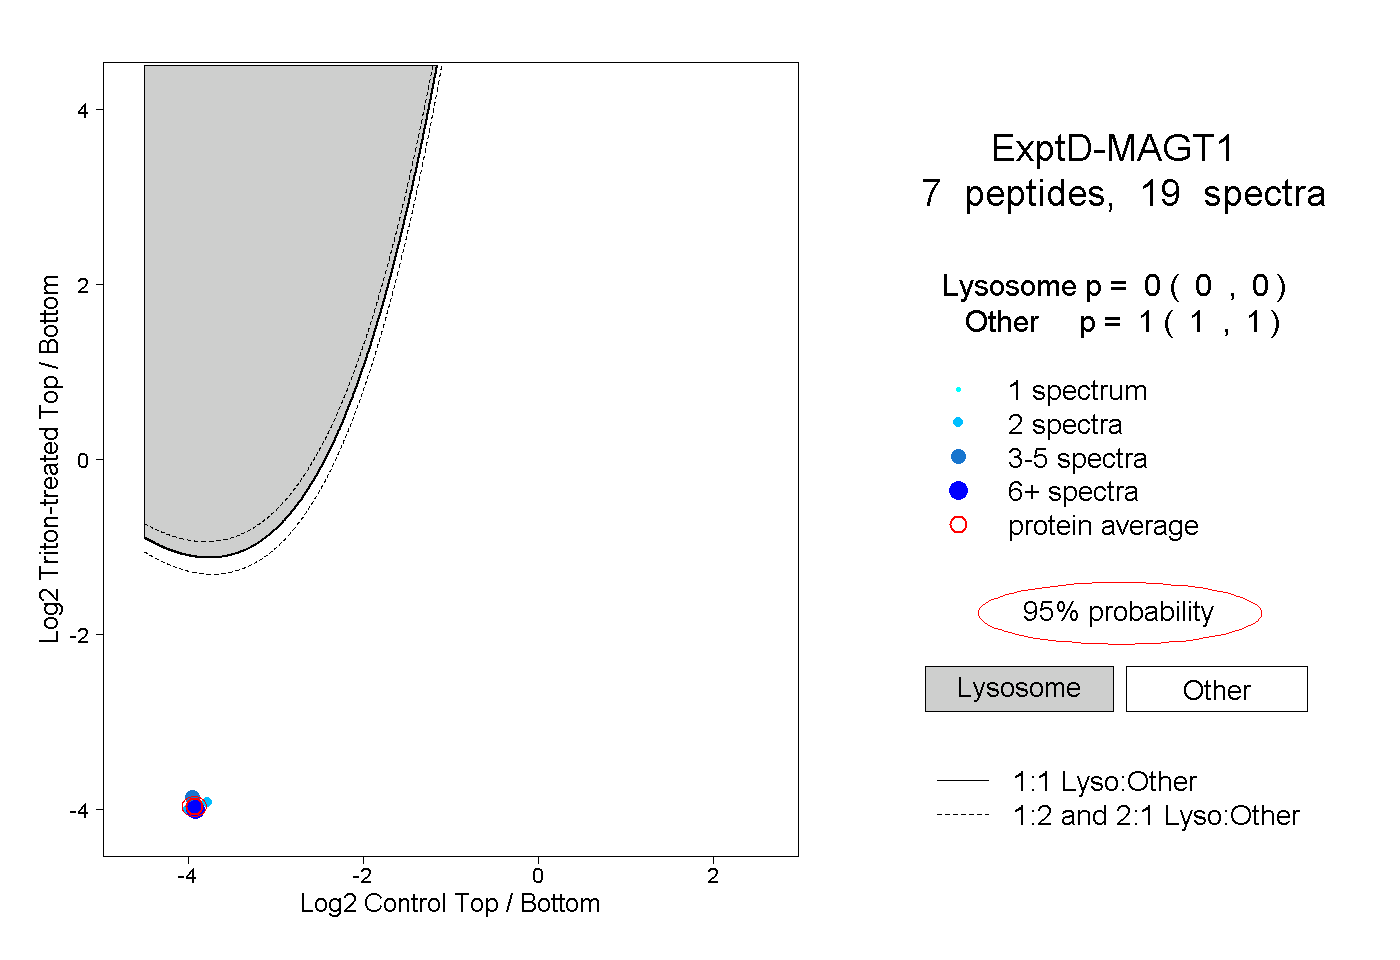 |
0.000 0.000 | 0.000 |
1.000 1.000 | 1.000 |