 2
2peptides
spectra
0.000 | 0.000
0.000 | 0.000
0.272 | 0.351
0.000 | 0.088
0.365 | 0.534
0.000 | 0.103
0.129 | 0.192
0.000 | 0.000
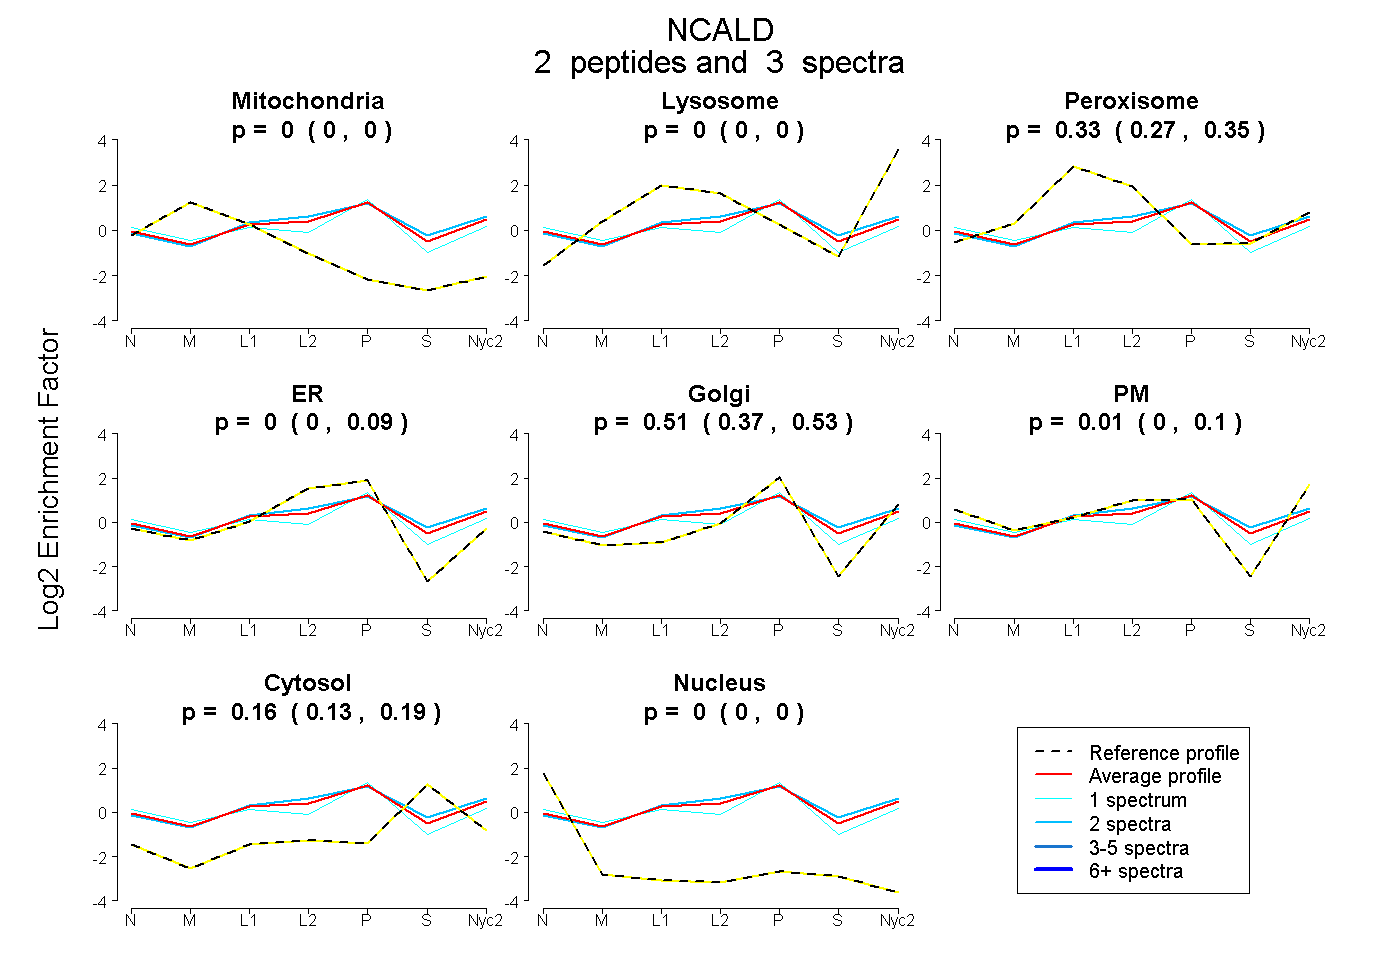
| Plot | Mito | Lyso | Perox | ER | Golgi | PM | Cytosol | Nucleus | |||||
| Expt A |
2 peptides |
3 spectra |
|
0.000 0.000 | 0.000 |
0.000 0.000 | 0.000 |
0.328 0.272 | 0.351 |
0.000 0.000 | 0.088 |
0.507 0.365 | 0.534 |
0.008 0.000 | 0.103 |
0.156 0.129 | 0.192 |
0.000 0.000 | 0.000 |
| 2 spectra, TFDANGDGTIDFR | 0.000 | 0.000 | 0.359 | 0.000 | 0.442 | 0.028 | 0.171 | 0.000 | ||
| 1 spectrum, AEMLEIVQAIYK | 0.016 | 0.000 | 0.259 | 0.000 | 0.597 | 0.000 | 0.102 | 0.025 |
| Plot | Lyso | Other | |||||||||||
| Expt C |
1 peptide |
2 spectra |
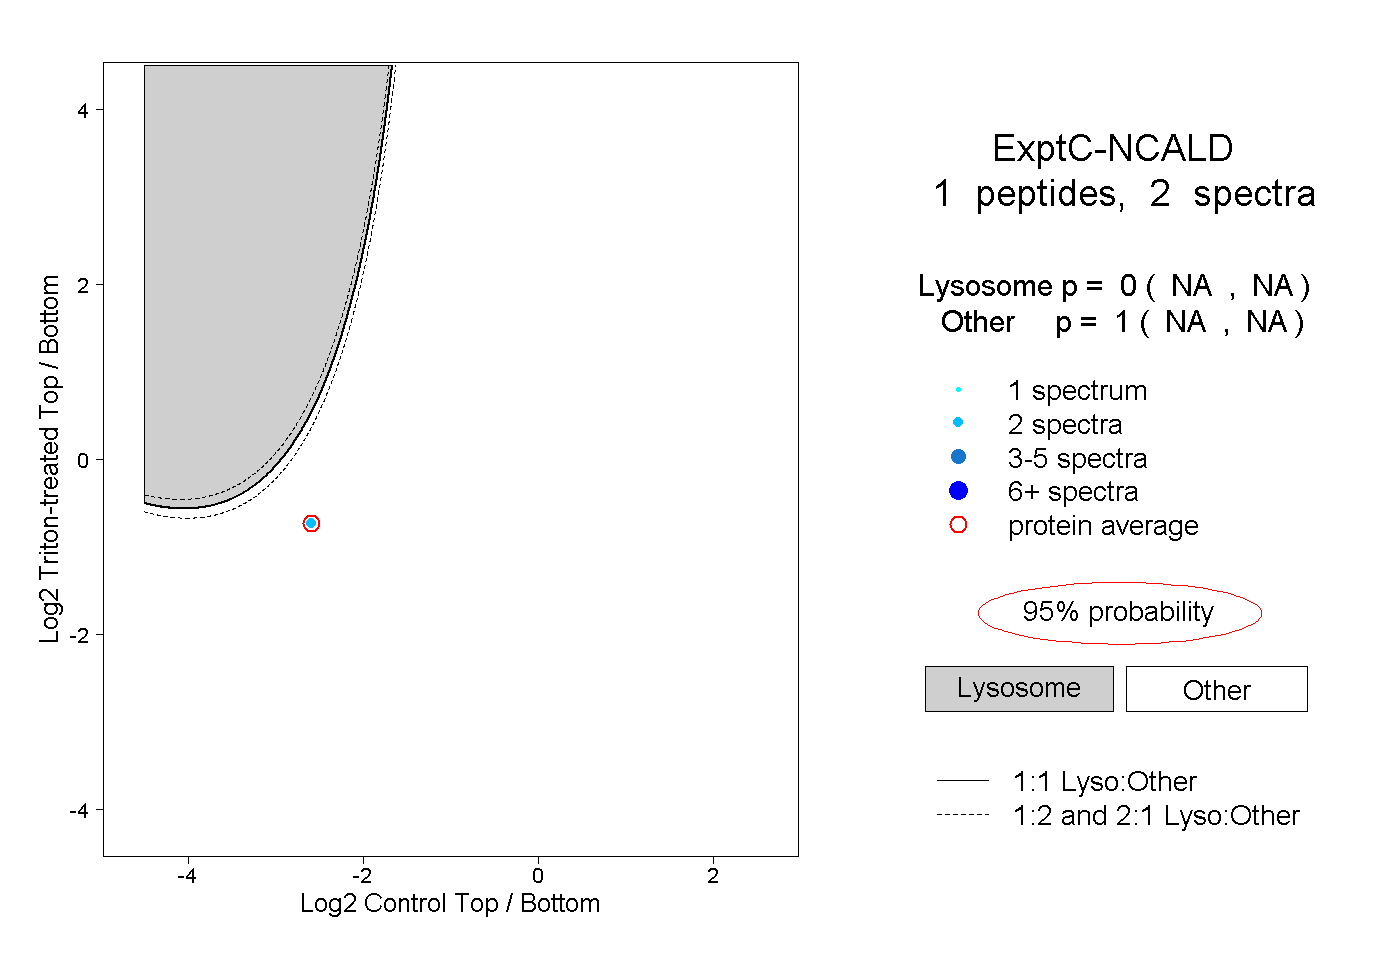 |
0.000 NA | NA |
1.000 NA | NA |