11
11peptides
spectra
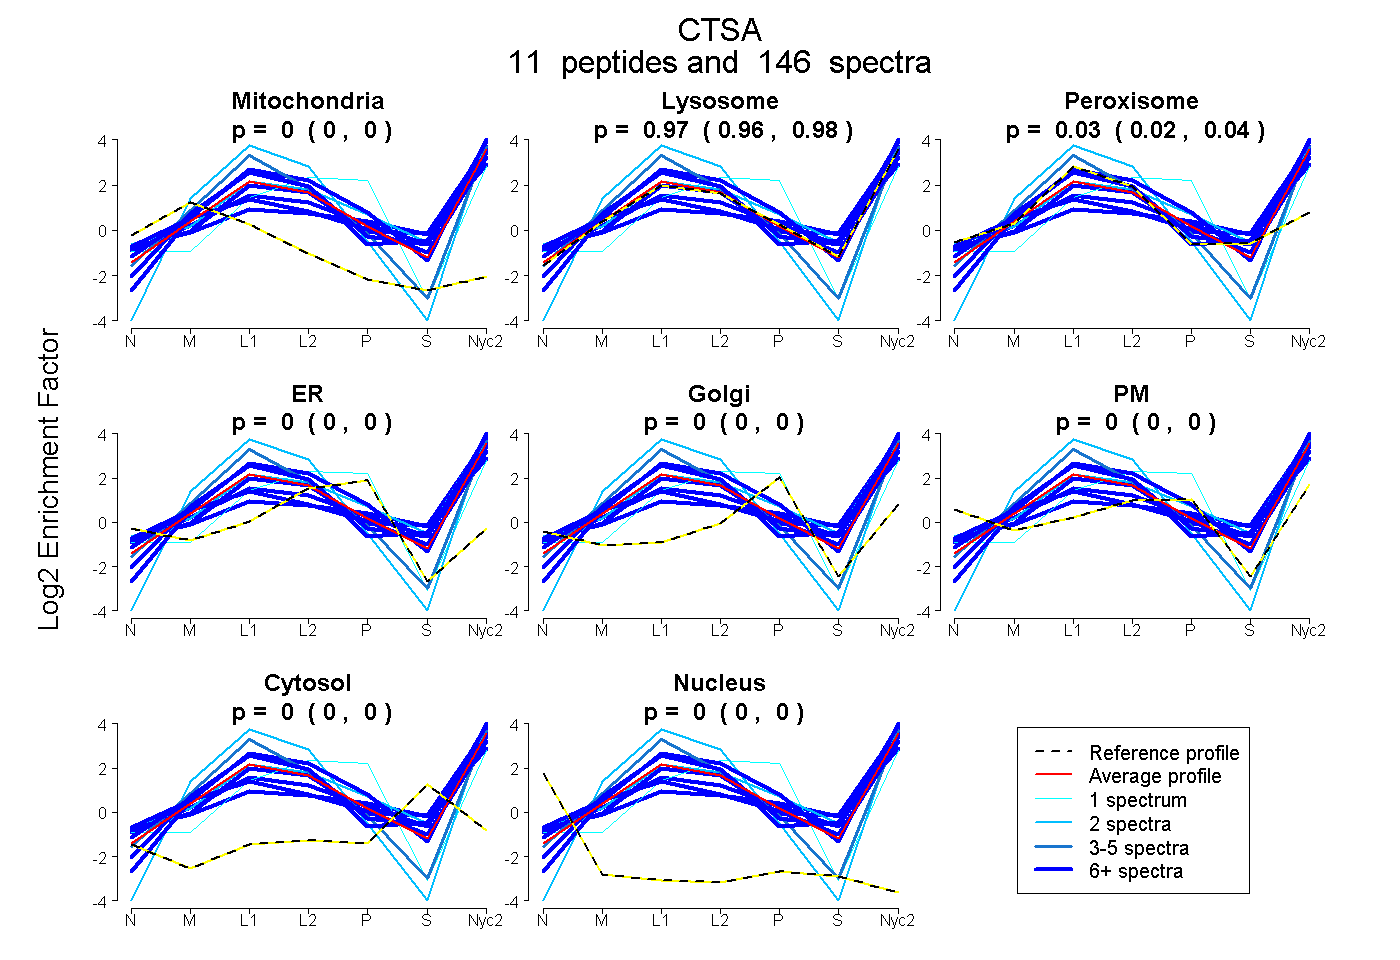
0.000 | 0.000
0.961 | 0.976
0.021 | 0.038
0.000 | 0.000
0.000 | 0.000
0.000 | 0.000
0.000 | 0.000
0.000 | 0.000
8peptides
spectra
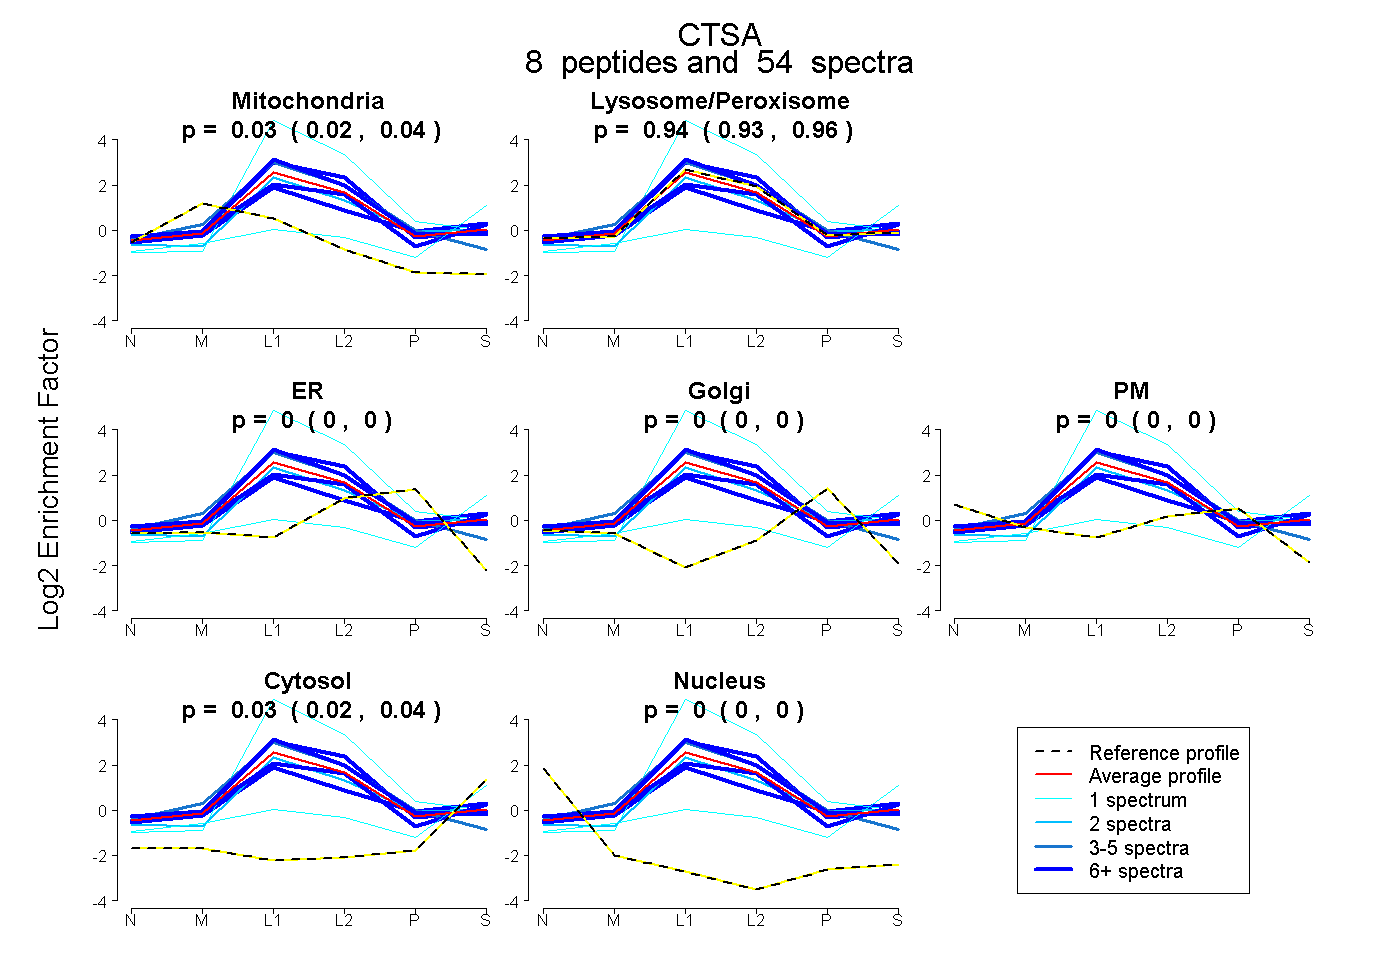
0.016 | 0.036
0.931 | 0.956
0.000 | 0.000
0.000 | 0.000
0.000 | 0.000
0.020 | 0.038
0.000 | 0.000
11peptides
spectra
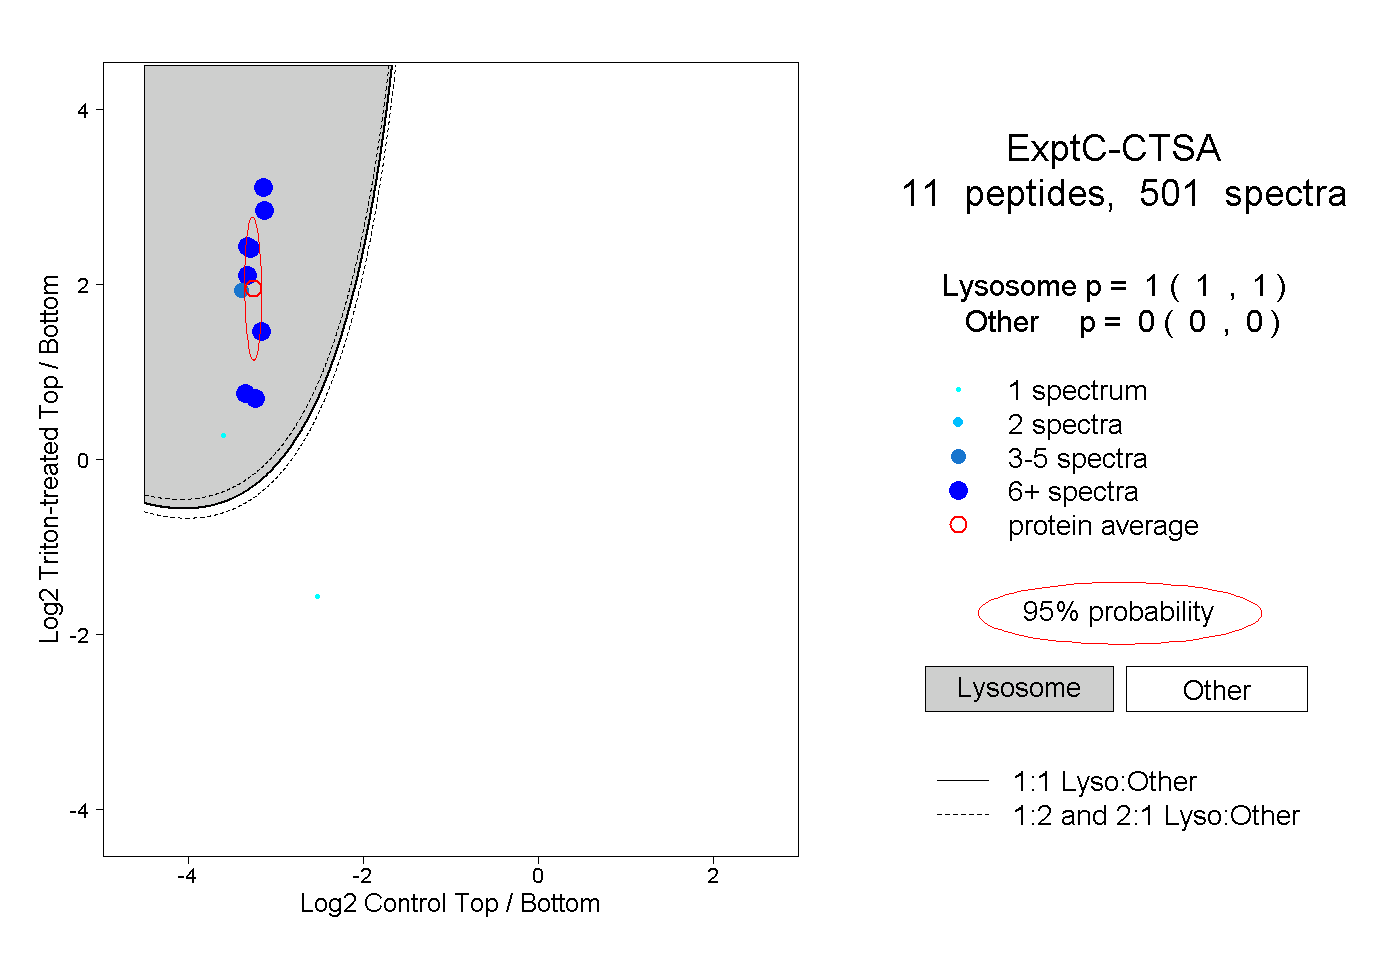
1.000 | 1.000
0.000 | 0.000