 11
11peptides
spectra
0.000 | 0.000
0.961 | 0.976
0.021 | 0.038
0.000 | 0.000
0.000 | 0.000
0.000 | 0.000
0.000 | 0.000
0.000 | 0.000
| Plot | Mito | Lyso | Perox | ER | Golgi | PM | Cytosol | Nucleus | |||||
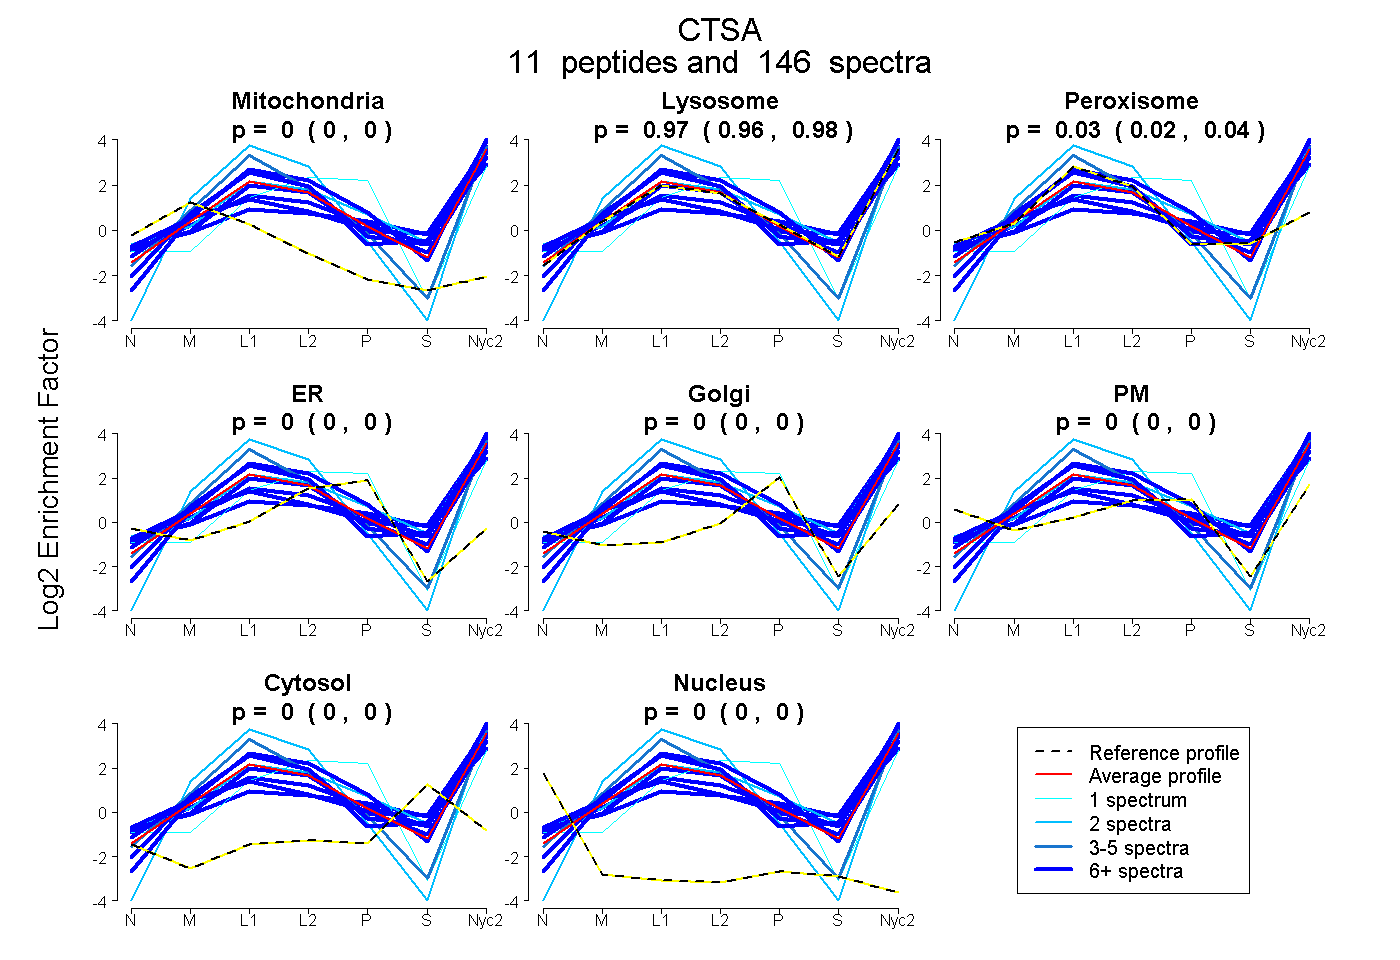
| Expt A |
11 peptides |
146 spectra |
|
0.000 0.000 | 0.000 |
0.969 0.961 | 0.976 |
0.031 0.021 | 0.038 |
0.000 0.000 | 0.000 |
0.000 0.000 | 0.000 |
0.000 0.000 | 0.000 |
0.000 0.000 | 0.000 |
0.000 0.000 | 0.000 |
| 4 spectra, LWTSLQTHCCSQNK | 0.013 | 0.987 | 0.000 | 0.000 | 0.000 | 0.000 | 0.000 | 0.000 | ||
| 16 spectra, LISSQK | 0.000 | 1.000 | 0.000 | 0.000 | 0.000 | 0.000 | 0.000 | 0.000 | ||
| 22 spectra, DFYHLFPEYK | 0.000 | 0.873 | 0.000 | 0.000 | 0.000 | 0.067 | 0.060 | 0.000 | ||
| 45 spectra, ALHIPESLPR | 0.000 | 0.683 | 0.000 | 0.000 | 0.000 | 0.126 | 0.191 | 0.000 | ||
| 2 spectra, LISNTK | 0.000 | 1.000 | 0.000 | 0.000 | 0.000 | 0.000 | 0.000 | 0.000 | ||
| 6 spectra, WDMCNLMVNLQYR | 0.000 | 0.761 | 0.239 | 0.000 | 0.000 | 0.000 | 0.000 | 0.000 | ||
| 22 spectra, QYSGYLK | 0.000 | 1.000 | 0.000 | 0.000 | 0.000 | 0.000 | 0.000 | 0.000 | ||
| 6 spectra, DPDCVNNLQEVSR | 0.000 | 0.891 | 0.063 | 0.000 | 0.000 | 0.000 | 0.046 | 0.000 | ||
| 1 spectrum, FPEALLLR | 0.000 | 0.517 | 0.000 | 0.434 | 0.000 | 0.049 | 0.000 | 0.000 | ||
| 20 spectra, LYESMNSQYLK | 0.009 | 0.856 | 0.000 | 0.000 | 0.000 | 0.063 | 0.004 | 0.068 | ||
| 2 spectra, HFHYWFVESQNDPK | 0.000 | 0.975 | 0.000 | 0.000 | 0.000 | 0.025 | 0.000 | 0.000 |
| Plot | Mito | Lyso or Perox | ER | Golgi | PM | Cytosol | Nucleus | ||||||
| Expt B |
8 peptides |
54 spectra |
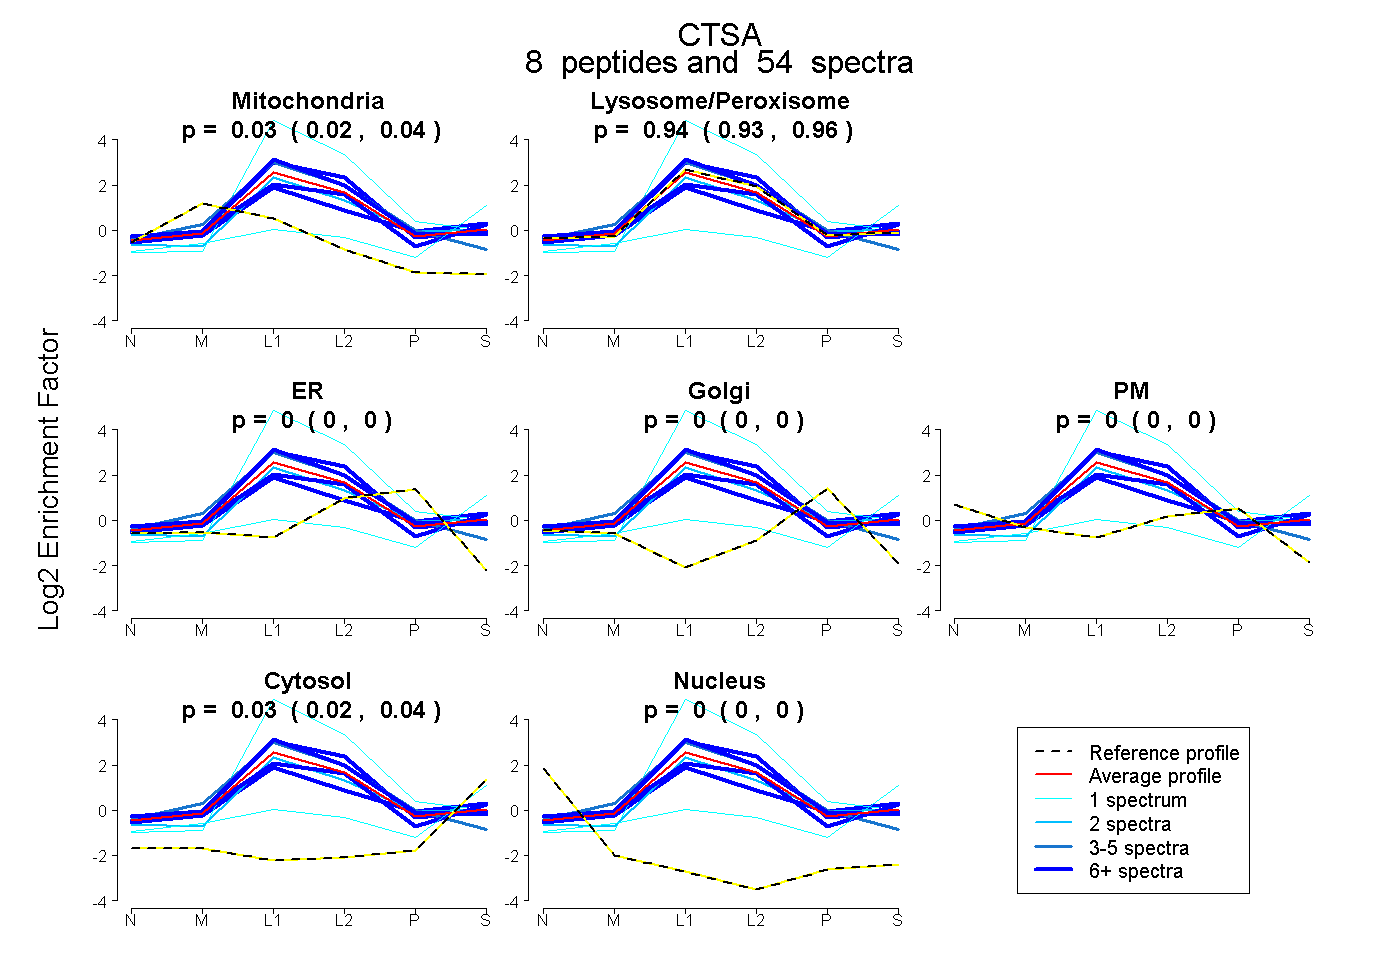 |
0.026 0.016 | 0.036 |
0.944 0.931 | 0.956 |
0.000 0.000 | 0.000 |
0.000 0.000 | 0.000 |
0.000 0.000 | 0.000 |
0.030 0.020 | 0.038 |
0.000 0.000 | 0.000 |
|||
| Plot | Lyso | Other | |||||||||||
| Expt C |
11 peptides |
501 spectra |
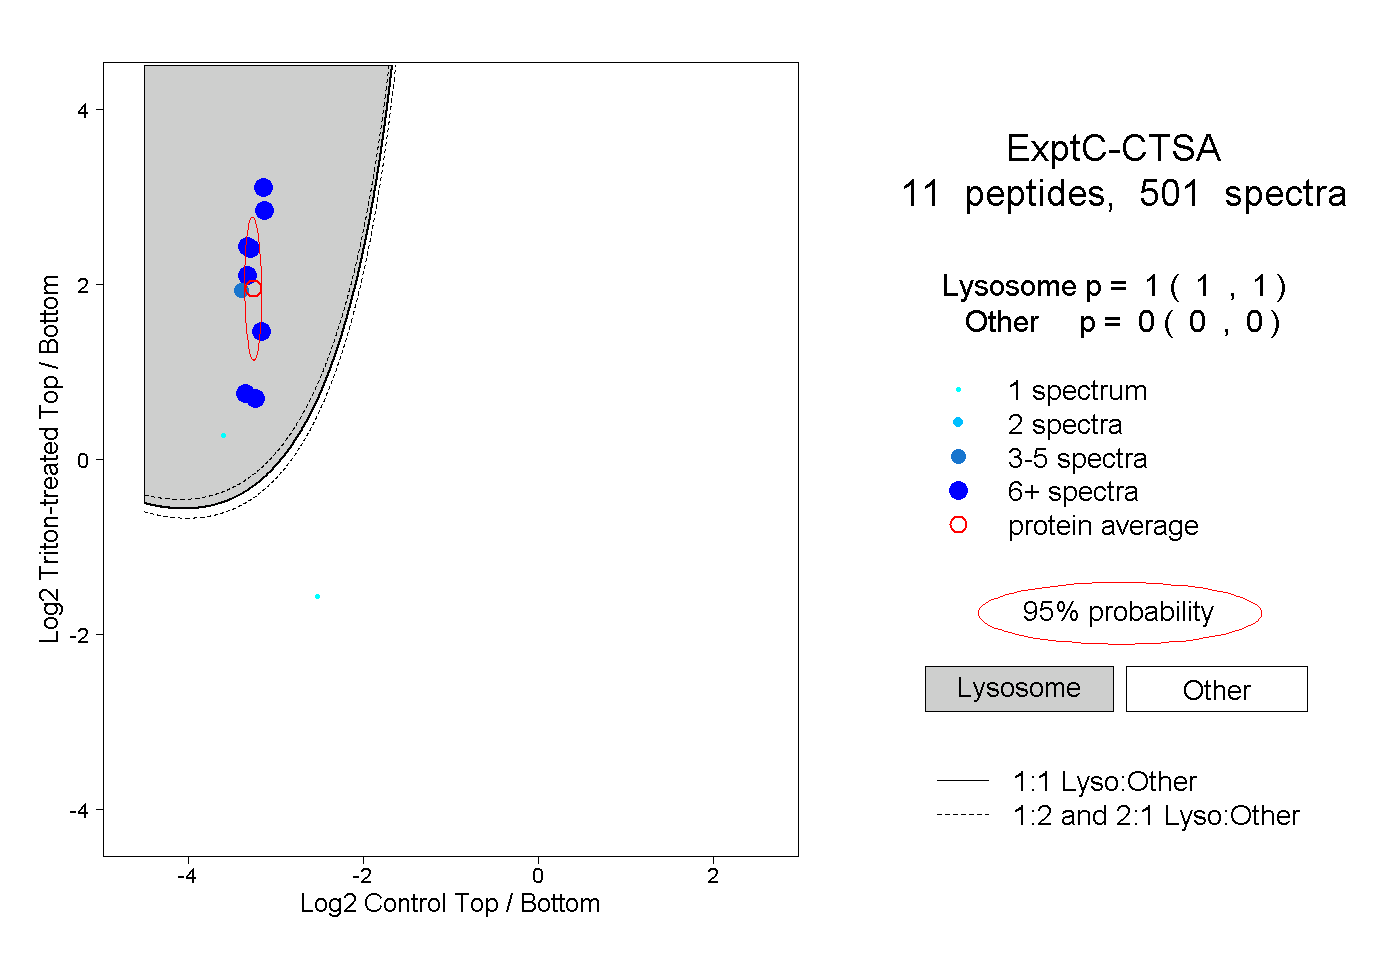 |
1.000 1.000 | 1.000 |
0.000 0.000 | 0.000 |
||||||||
| Plot | Lyso | Other | |||||||||||
| Expt D |
6 peptides |
25 spectra |
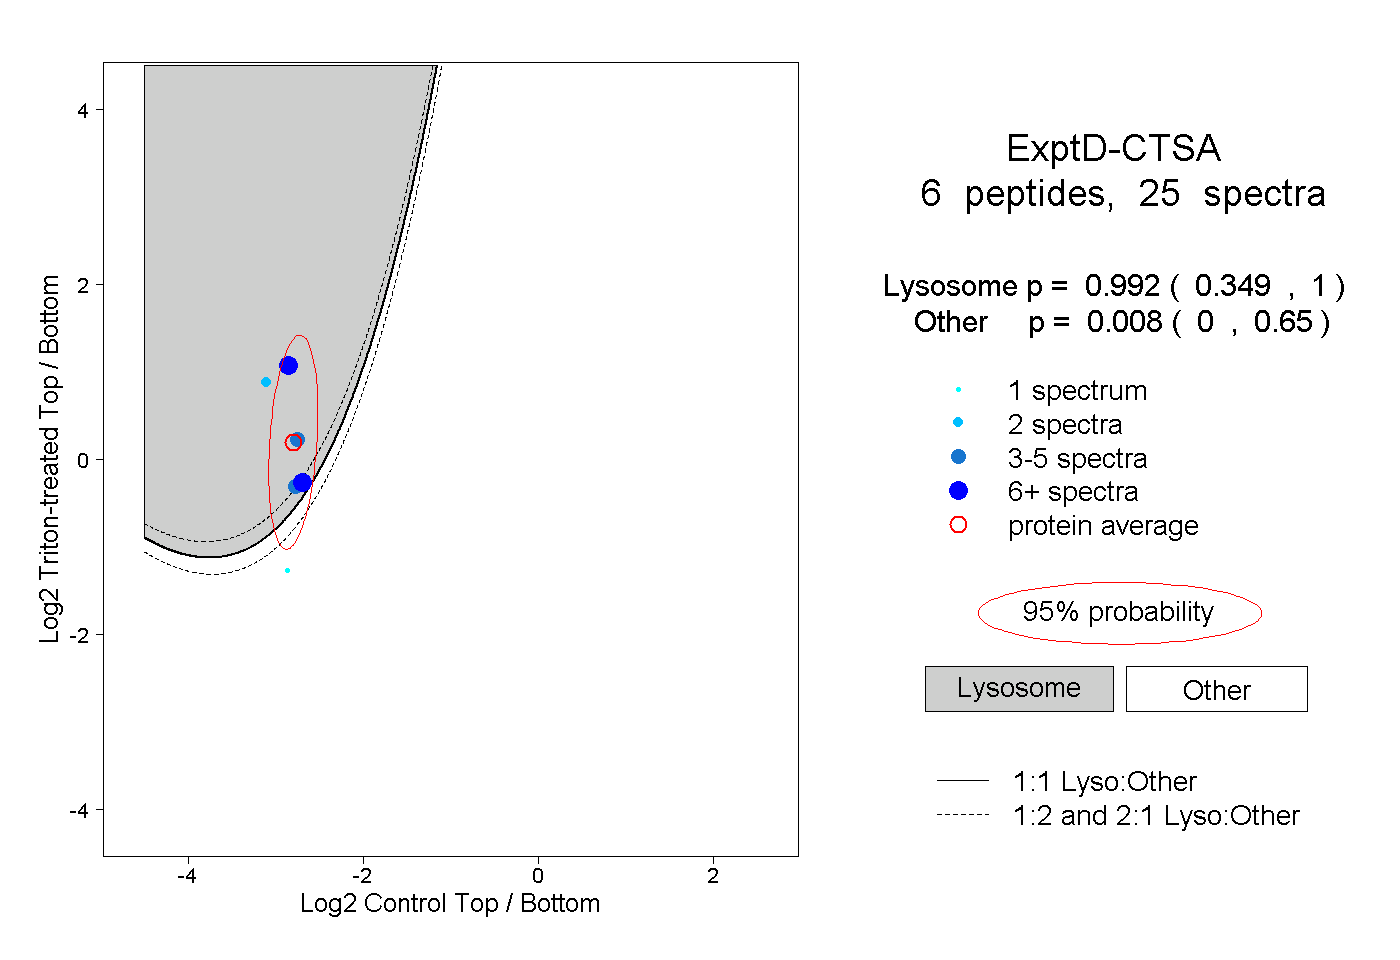 |
0.992 0.349 | 1.000 |
0.008 0.000 | 0.650 |