 14
14peptides
spectra
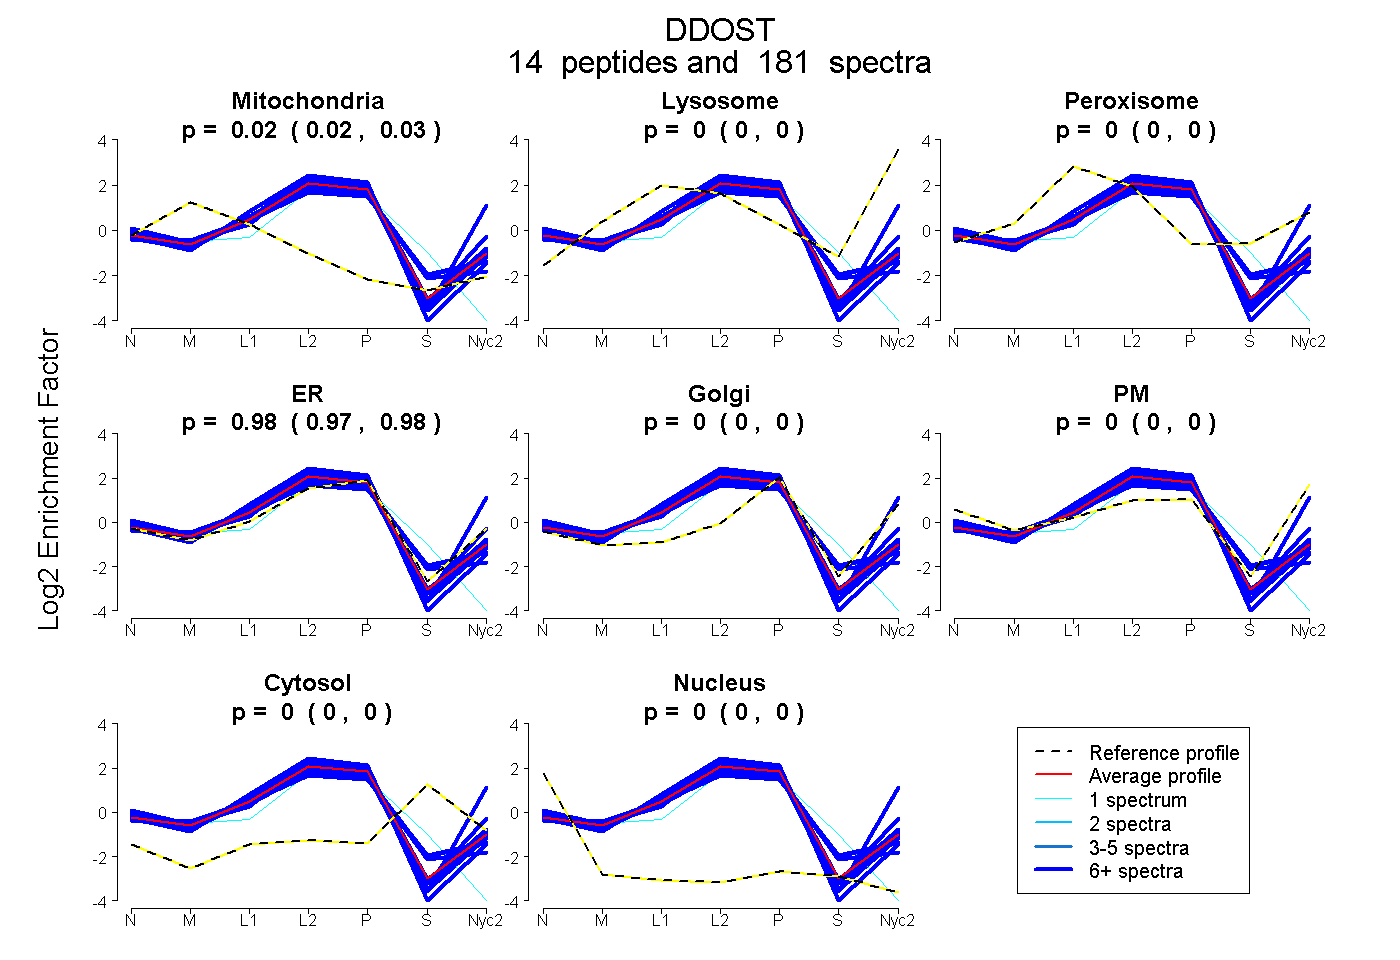
0.022 | 0.026
0.000 | 0.000
0.000 | 0.002
0.973 | 0.977
0.000 | 0.000
0.000 | 0.000
0.000 | 0.000
0.000 | 0.000
11peptides
spectra

0.000 | 0.000
0.113 | 0.123
0.876 | 0.886
0.000 | 0.000
0.000 | 0.000
0.000 | 0.000
0.000 | 0.000
14peptides
spectra
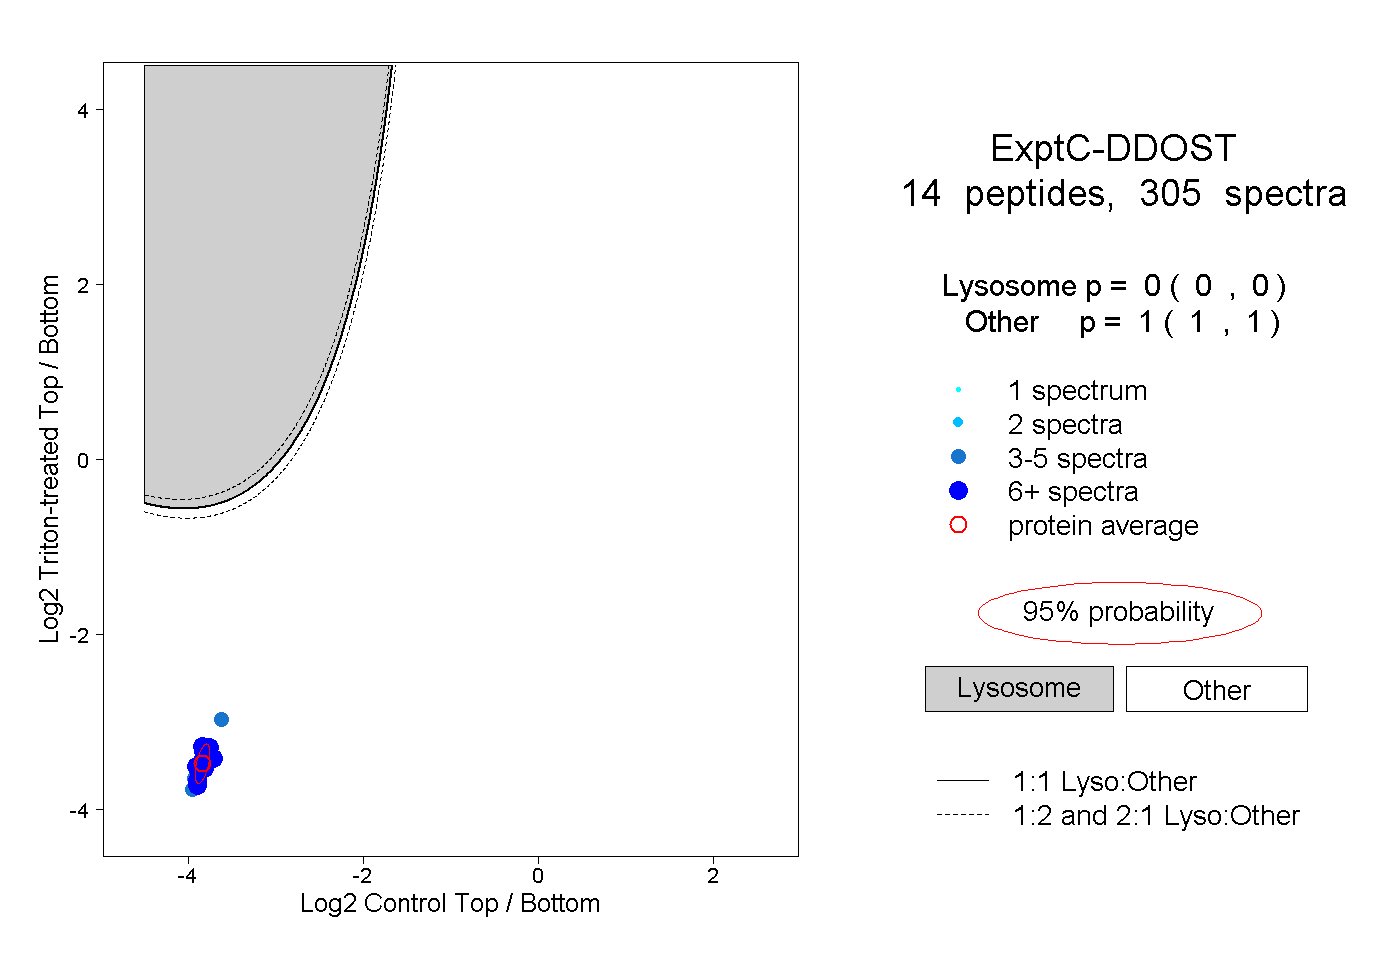
0.000 | 0.000
1.000 | 1.000
8peptides
spectra
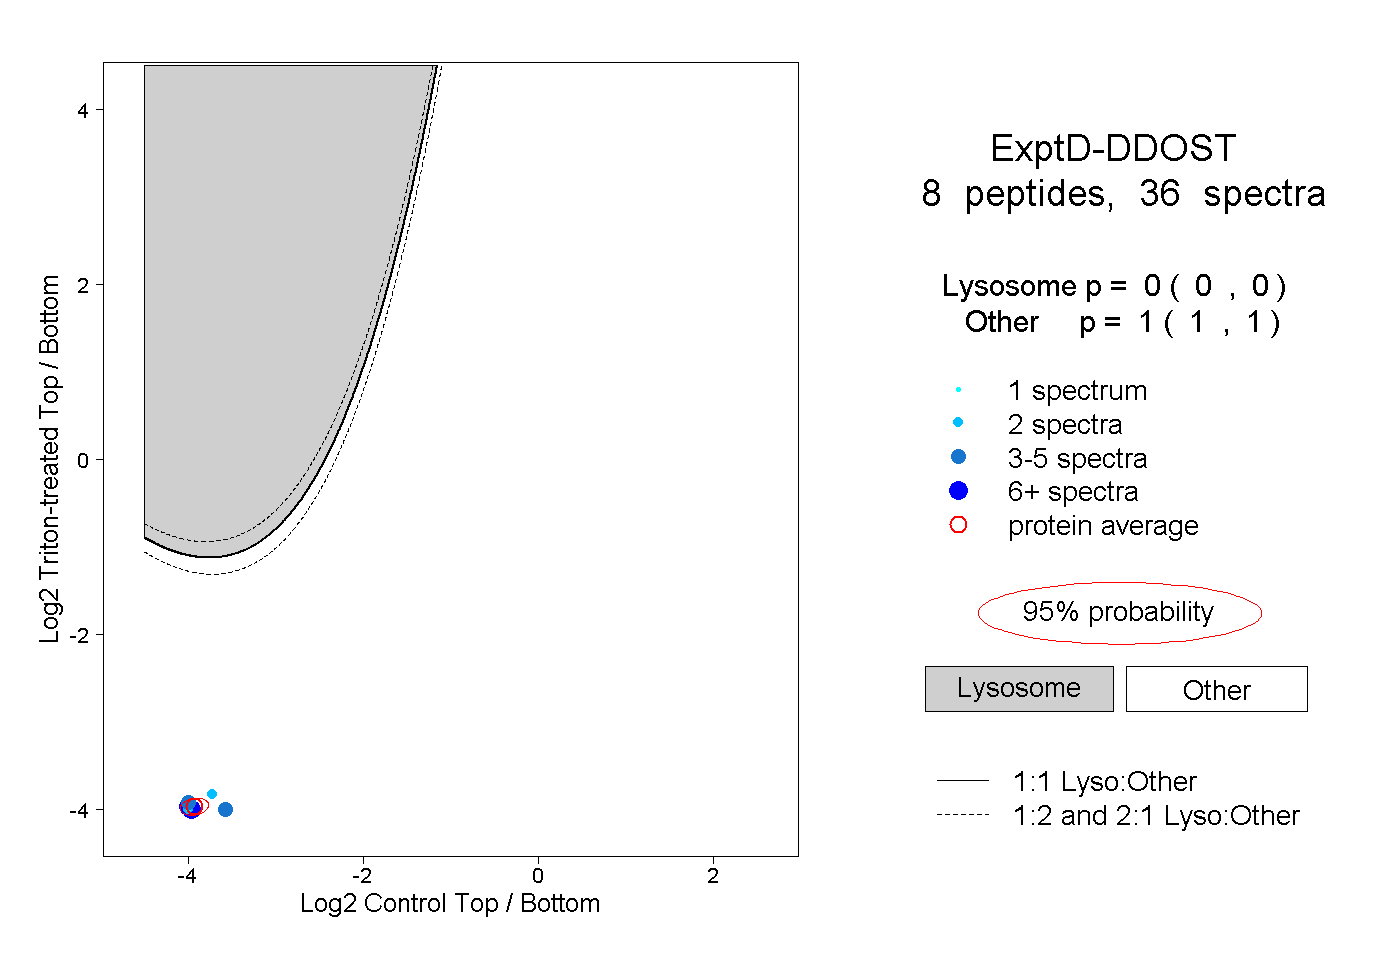
0.000 | 0.000
1.000 | 1.000