 14
14peptides
spectra
0.022 | 0.026
0.000 | 0.000
0.000 | 0.002
0.973 | 0.977
0.000 | 0.000
0.000 | 0.000
0.000 | 0.000
0.000 | 0.000
| Plot | Mito | Lyso | Perox | ER | Golgi | PM | Cytosol | Nucleus | |||||
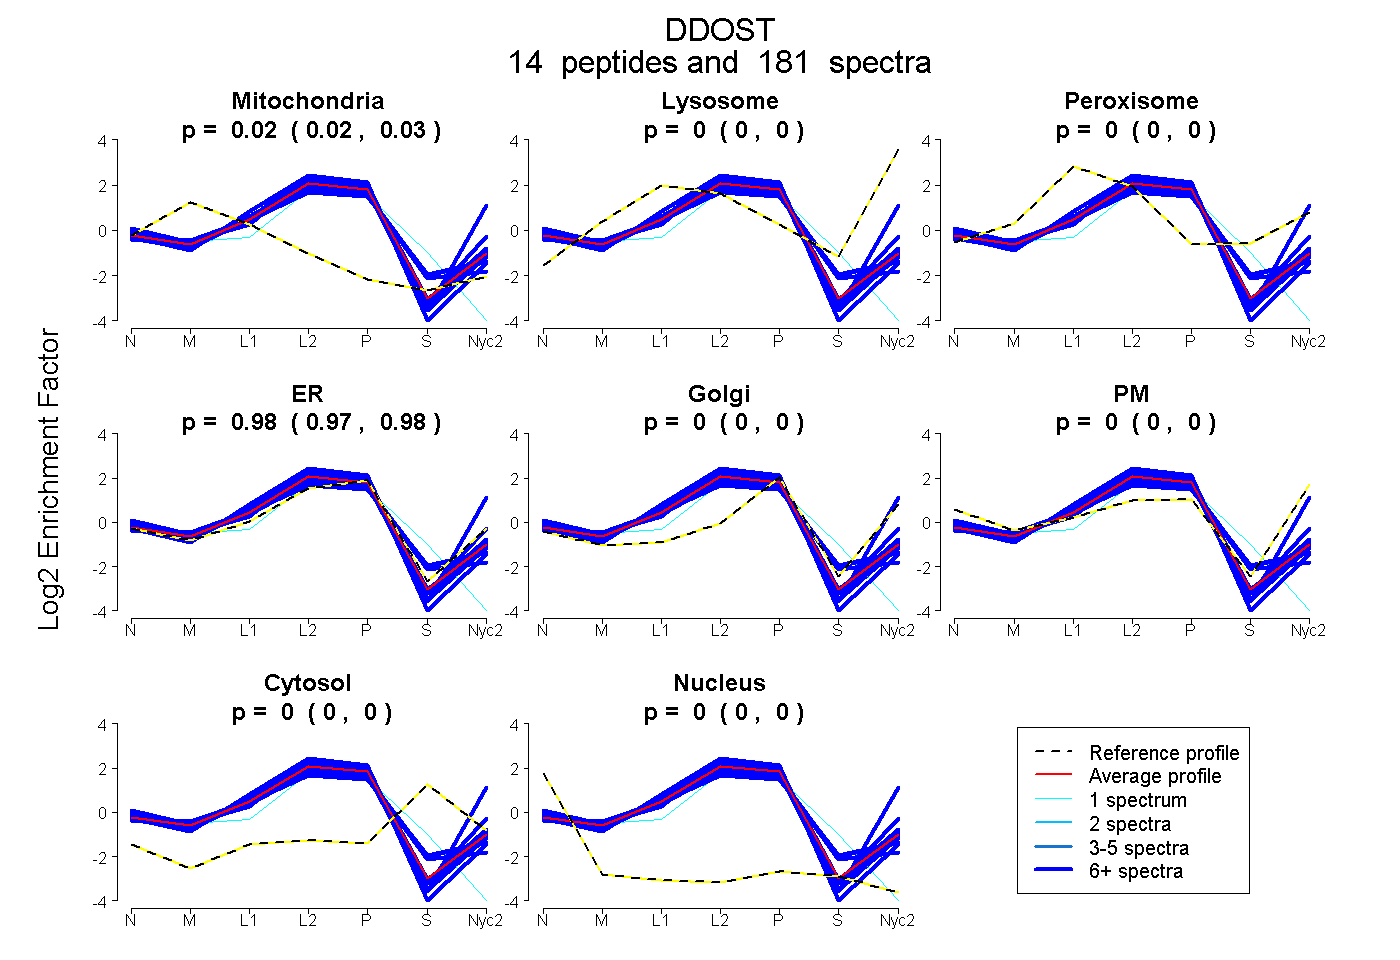
| Expt A |
14 peptides |
181 spectra |
|
0.024 0.022 | 0.026 |
0.000 0.000 | 0.000 |
0.000 0.000 | 0.002 |
0.976 0.973 | 0.977 |
0.000 0.000 | 0.000 |
0.000 0.000 | 0.000 |
0.000 0.000 | 0.000 |
0.000 0.000 | 0.000 |
| 20 spectra, TLVLLDNLNVR | 0.007 | 0.000 | 0.015 | 0.978 | 0.000 | 0.000 | 0.000 | 0.000 | ||
| 7 spectra, APTIVGK | 0.000 | 0.000 | 0.031 | 0.969 | 0.000 | 0.000 | 0.000 | 0.000 | ||
| 7 spectra, WVPFDGDDIQLEFVR | 0.000 | 0.000 | 0.000 | 1.000 | 0.000 | 0.000 | 0.000 | 0.000 | ||
| 9 spectra, TADDPSLSLIK | 0.051 | 0.000 | 0.105 | 0.802 | 0.000 | 0.000 | 0.016 | 0.026 | ||
| 22 spectra, LPDVYGVFQFK | 0.125 | 0.000 | 0.029 | 0.844 | 0.000 | 0.000 | 0.000 | 0.001 | ||
| 9 spectra, GFELTFK | 0.005 | 0.000 | 0.000 | 0.995 | 0.000 | 0.000 | 0.000 | 0.000 | ||
| 11 spectra, YSVQFK | 0.038 | 0.000 | 0.000 | 0.962 | 0.000 | 0.000 | 0.000 | 0.000 | ||
| 18 spectra, IDPFVR | 0.000 | 0.000 | 0.000 | 1.000 | 0.000 | 0.000 | 0.000 | 0.000 | ||
| 9 spectra, YSQTGNYELAVALSR | 0.000 | 0.000 | 0.000 | 1.000 | 0.000 | 0.000 | 0.000 | 0.000 | ||
| 15 spectra, DTHSLFFR | 0.082 | 0.000 | 0.070 | 0.841 | 0.000 | 0.000 | 0.008 | 0.000 | ||
| 27 spectra, SSLNPILFR | 0.000 | 0.000 | 0.000 | 1.000 | 0.000 | 0.000 | 0.000 | 0.000 | ||
| 13 spectra, AAPGAGAR | 0.000 | 0.000 | 0.000 | 1.000 | 0.000 | 0.000 | 0.000 | 0.000 | ||
| 1 spectrum, ELGSECGIEFDEEK | 0.116 | 0.000 | 0.000 | 0.697 | 0.000 | 0.000 | 0.095 | 0.092 | ||
| 13 spectra, NTLLIAGLQAR | 0.000 | 0.075 | 0.000 | 0.588 | 0.000 | 0.337 | 0.000 | 0.000 |
| Plot | Mito | Lyso or Perox | ER | Golgi | PM | Cytosol | Nucleus | ||||||
| Expt B |
11 peptides |
105 spectra |
 |
0.000 0.000 | 0.000 |
0.118 0.113 | 0.123 |
0.882 0.876 | 0.886 |
0.000 0.000 | 0.000 |
0.000 0.000 | 0.000 |
0.000 0.000 | 0.000 |
0.000 0.000 | 0.000 |
|||
| Plot | Lyso | Other | |||||||||||
| Expt C |
14 peptides |
305 spectra |
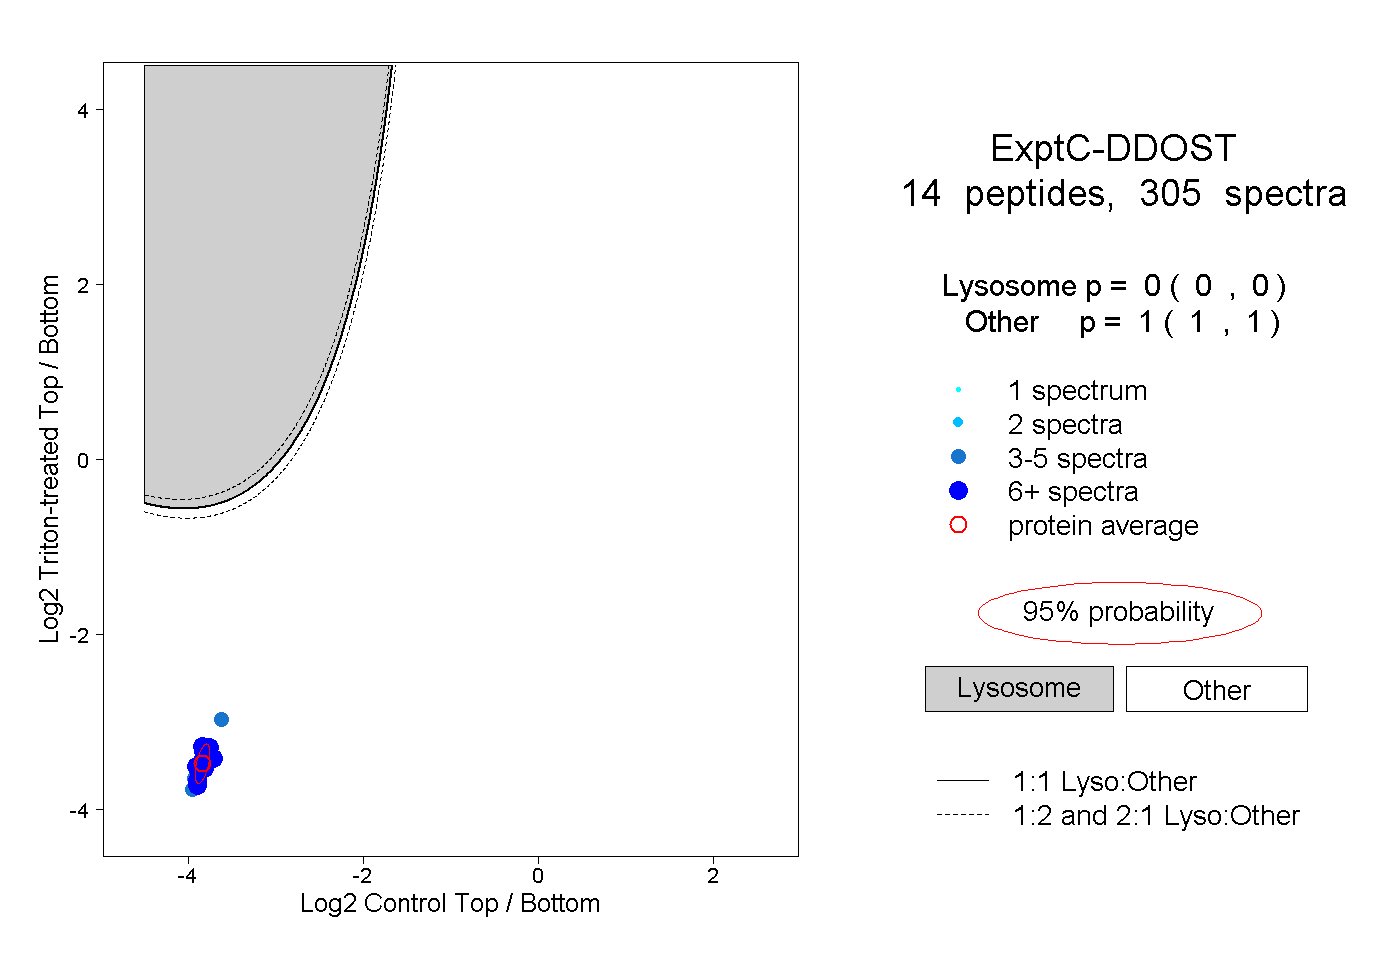 |
0.000 0.000 | 0.000 |
1.000 1.000 | 1.000 |
||||||||
| Plot | Lyso | Other | |||||||||||
| Expt D |
8 peptides |
36 spectra |
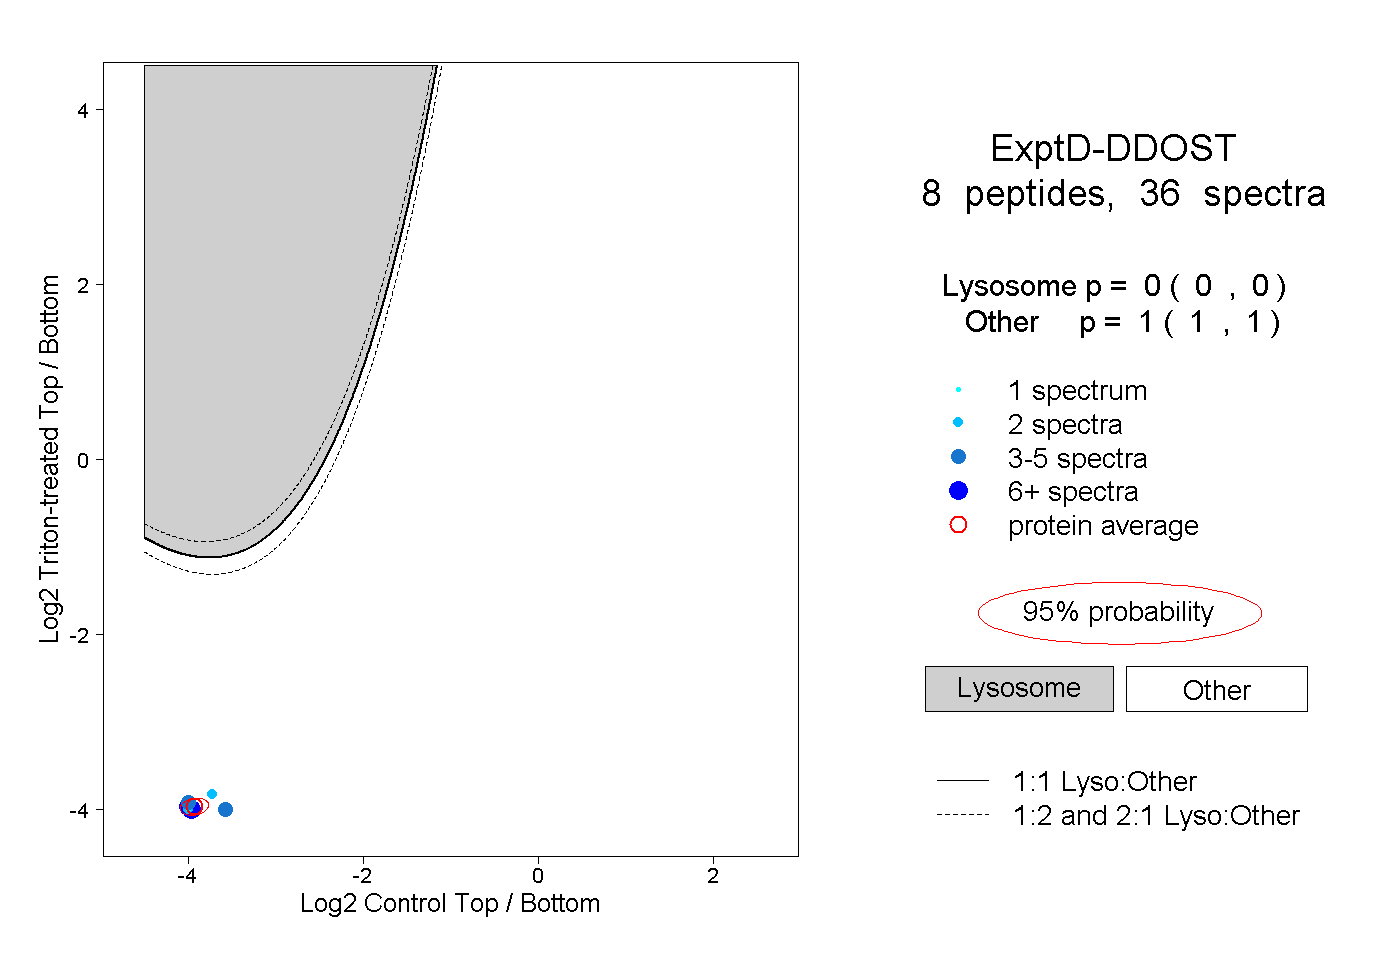 |
0.000 0.000 | 0.000 |
1.000 1.000 | 1.000 |