CSNK1A1
[ENSRNOP00000062327]
Main page
| | | Plot |
Mito |
Lyso |
|
Perox |
ER |
Golgi |
PM |
Cytosol |
Nucleus |
|
| Expt A |
 9
9
peptides |
20
spectra |
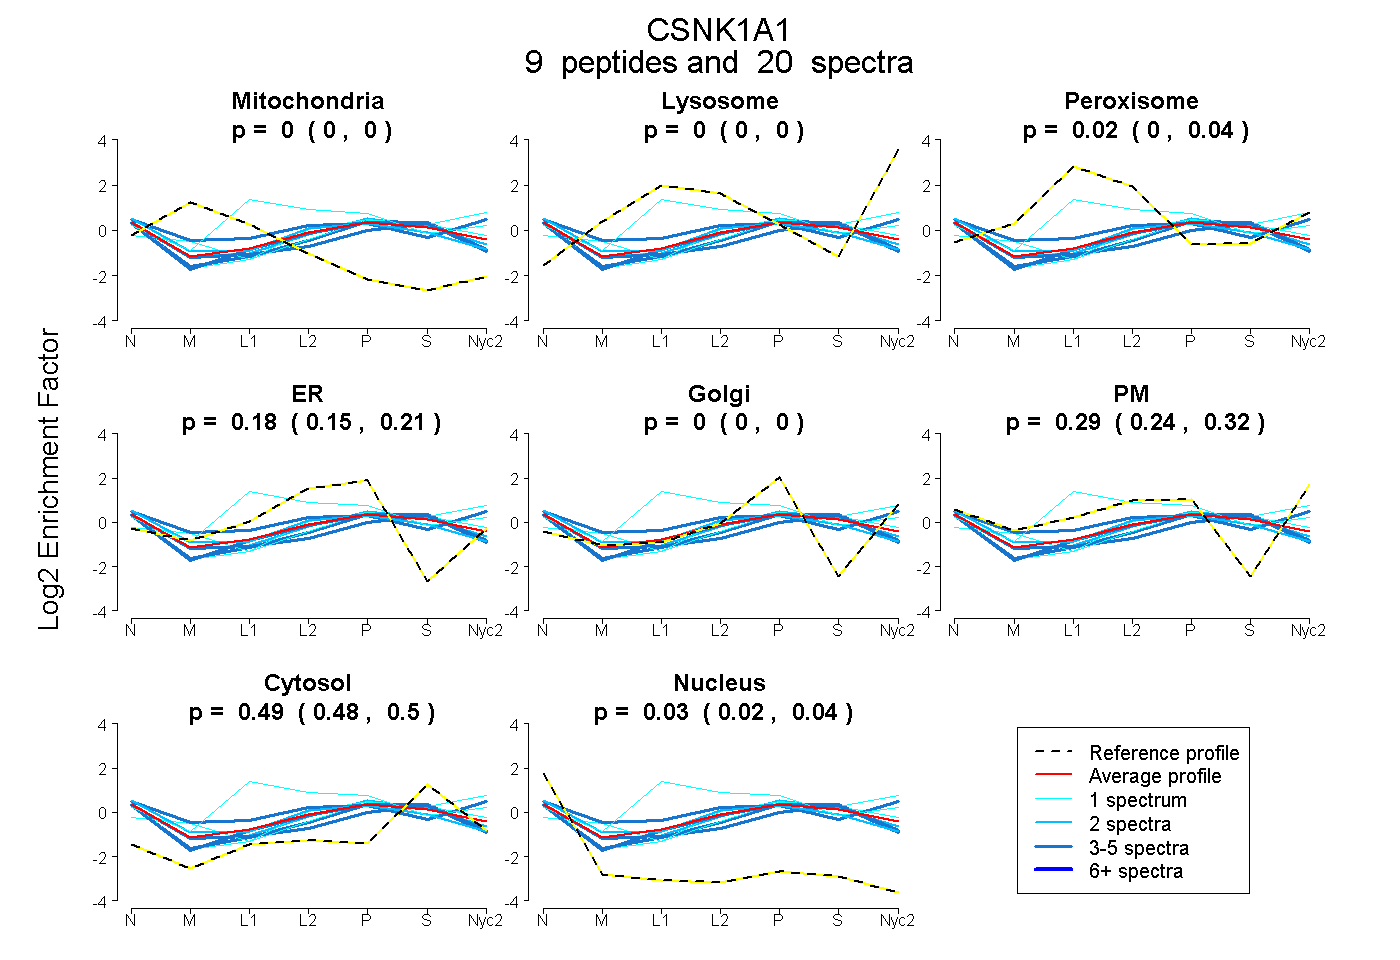 |
0.000
0.000 | 0.000 |
0.000
0.000 | 0.000 |
|
0.017
0.000 | 0.036 |
0.180
0.148 | 0.205 |
0.000
0.000 | 0.000 |
0.286
0.245 | 0.321 |
0.489
0.476 | 0.500 |
0.028
0.018 | 0.037 |
|
| | | Plot |
Mito |
|
Lyso or Perox |
|
ER |
Golgi |
PM |
Cytosol |
Nucleus |
|
| Expt B |
3
peptides |
4
spectra |
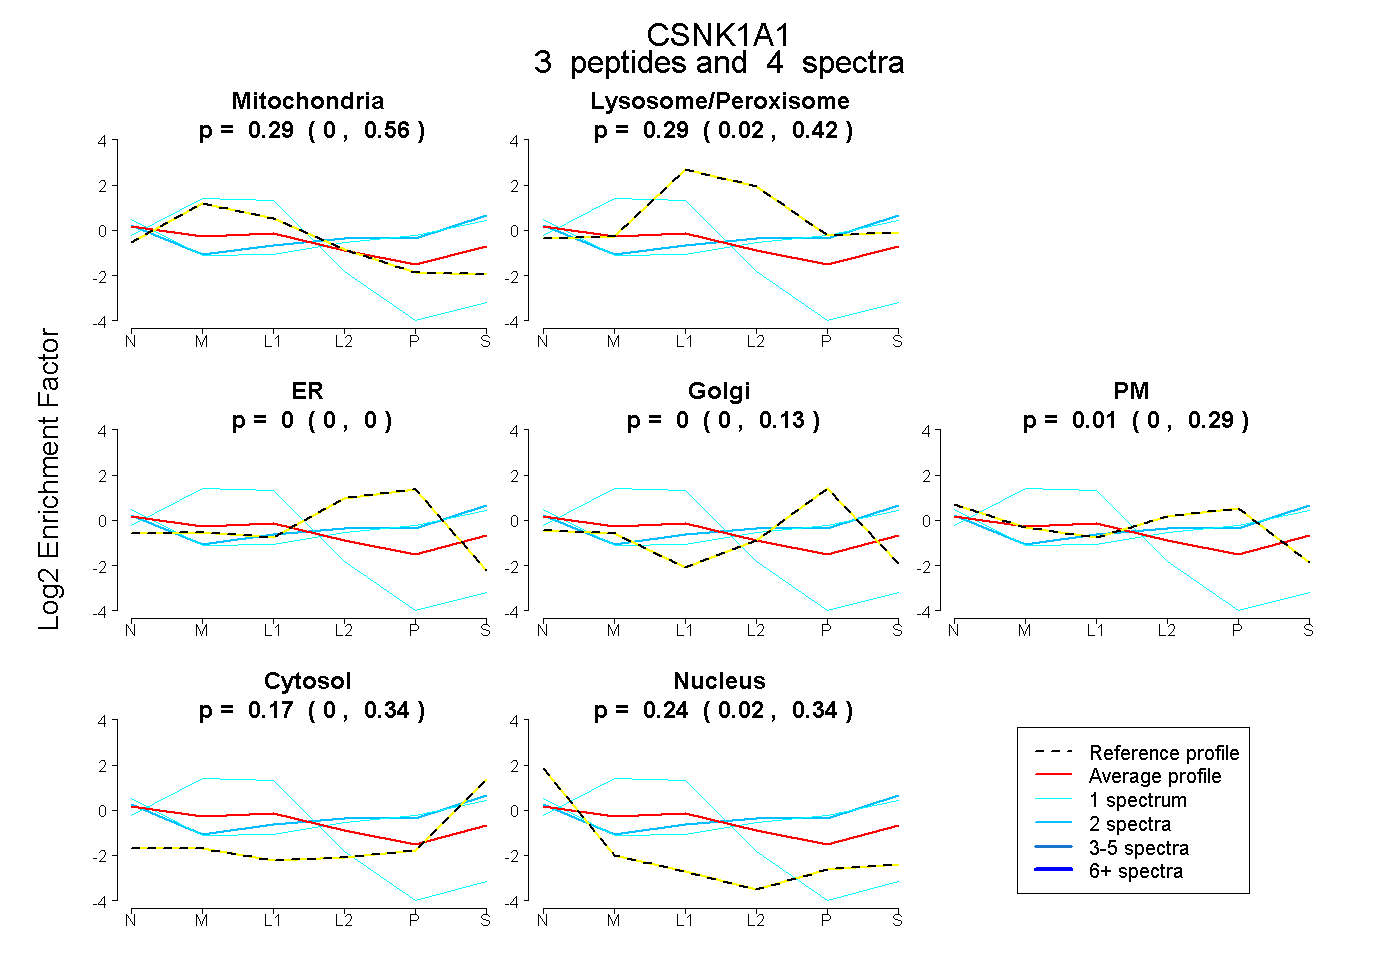 |
0.291
0.000 | 0.560 |
|
0.287
0.021 | 0.421 |
|
0.000
0.000 | 0.004 |
0.000
0.000 | 0.131 |
0.013
0.000 | 0.287 |
0.173
0.000 | 0.339 |
0.236
0.020 | 0.338 |
|
| | | Plot |
|
Lyso |
|
|
|
|
|
|
|
Other |
| Expt C |
7
peptides |
16
spectra |
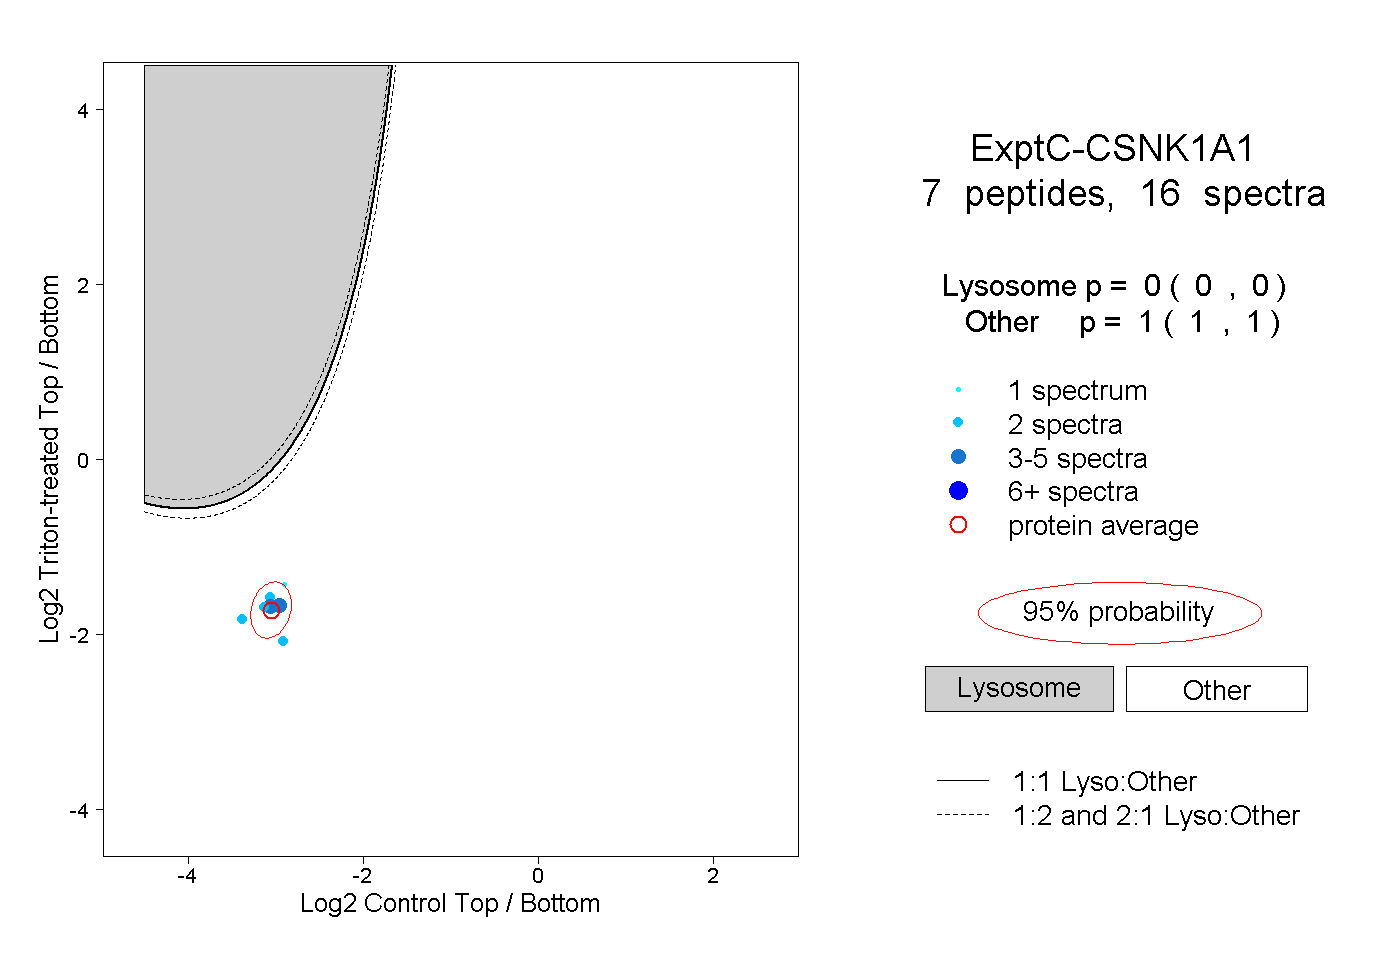 |
|
0.000
0.000 | 0.000 |
|
|
|
|
|
|
|
1.000
1.000 | 1.000 |
| 2 spectra, NLTGTAR |
|
0.000 |
|
|
|
|
|
|
|
1.000 |
| 2 spectra, HPQLLYESK |
|
0.000 |
|
|
|
|
|
|
|
1.000 |
| 2 spectra, AEFIVGGK |
|
0.000 |
|
|
|
|
|
|
|
1.000 |
| 2 spectra, TSLPWQGLK |
|
0.000 |
|
|
|
|
|
|
|
1.000 |
| 3 spectra, DIKPDNFLMGIGR |
|
0.000 |
|
|
|
|
|
|
|
1.000 |
| 4 spectra, IEYVHTK |
|
0.000 |
|
|
|
|
|
|
|
1.000 |
| 1 spectrum, FEEAPDYMYLR |
|
0.000 |
|
|
|
|
|
|
|
1.000 |