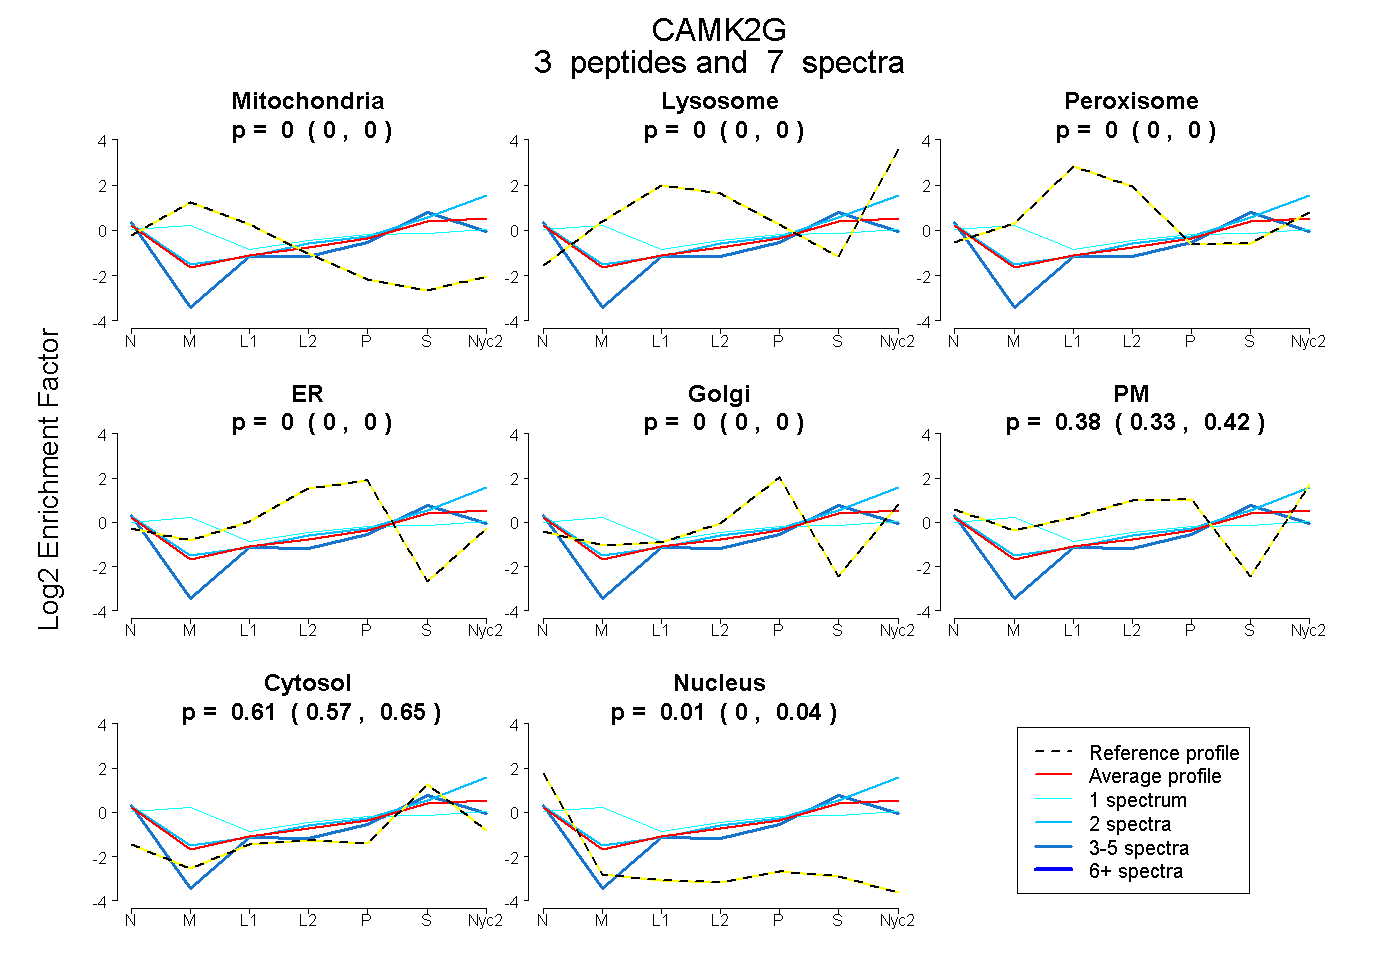
 3
3peptides
spectra
0.000 | 0.000
0.000 | 0.000
0.000 | 0.000
0.000 | 0.000
0.000 | 0.000
0.328 | 0.417
0.569 | 0.650
0.000 | 0.036
| Plot | Mito | Lyso | Perox | ER | Golgi | PM | Cytosol | Nucleus | |||||
| Expt A |
3 peptides |
7 spectra |
|
0.000 0.000 | 0.000 |
0.000 0.000 | 0.000 |
0.000 0.000 | 0.000 |
0.000 0.000 | 0.000 |
0.000 0.000 | 0.000 |
0.377 0.328 | 0.417 |
0.615 0.569 | 0.650 |
0.009 0.000 | 0.036 |
| 4 spectra, GAILTTMLVSR | 0.000 | 0.000 | 0.000 | 0.000 | 0.000 | 0.185 | 0.743 | 0.072 | ||
| 2 spectra, HPWVCQR | 0.000 | 0.069 | 0.000 | 0.000 | 0.000 | 0.378 | 0.553 | 0.000 | ||
| 1 spectrum, LTQYIDGQGRPR | 0.200 | 0.019 | 0.000 | 0.000 | 0.000 | 0.389 | 0.393 | 0.000 |
| Plot | Mito | Lyso or Perox | ER | Golgi | PM | Cytosol | Nucleus | ||||||
| Expt B |
1 peptide |
1 spectrum |
 |
0.000 NA | NA |
0.000 NA | NA |
0.000 NA | NA |
0.000 NA | NA |
0.510 NA | NA |
0.466 NA | NA |
0.024 NA | NA |
|||
| Plot | Lyso | Other | |||||||||||
| Expt C |
1 peptide |
1 spectrum |
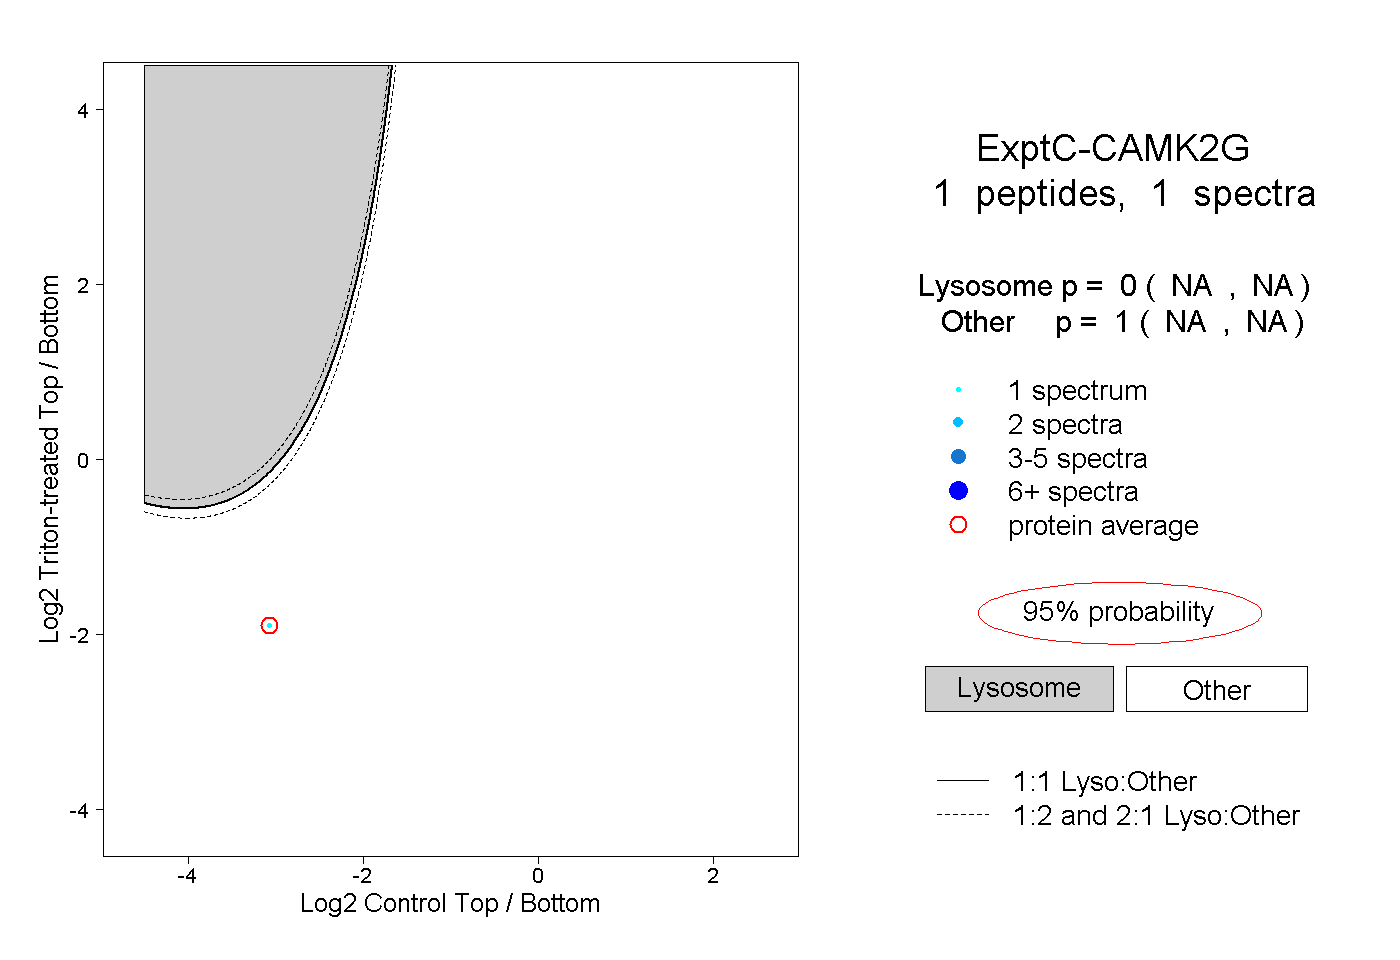 |
0.000 NA | NA |
1.000 NA | NA |
||||||||
| Plot | Lyso | Other | |||||||||||
| Expt D |
1 peptide |
1 spectrum |
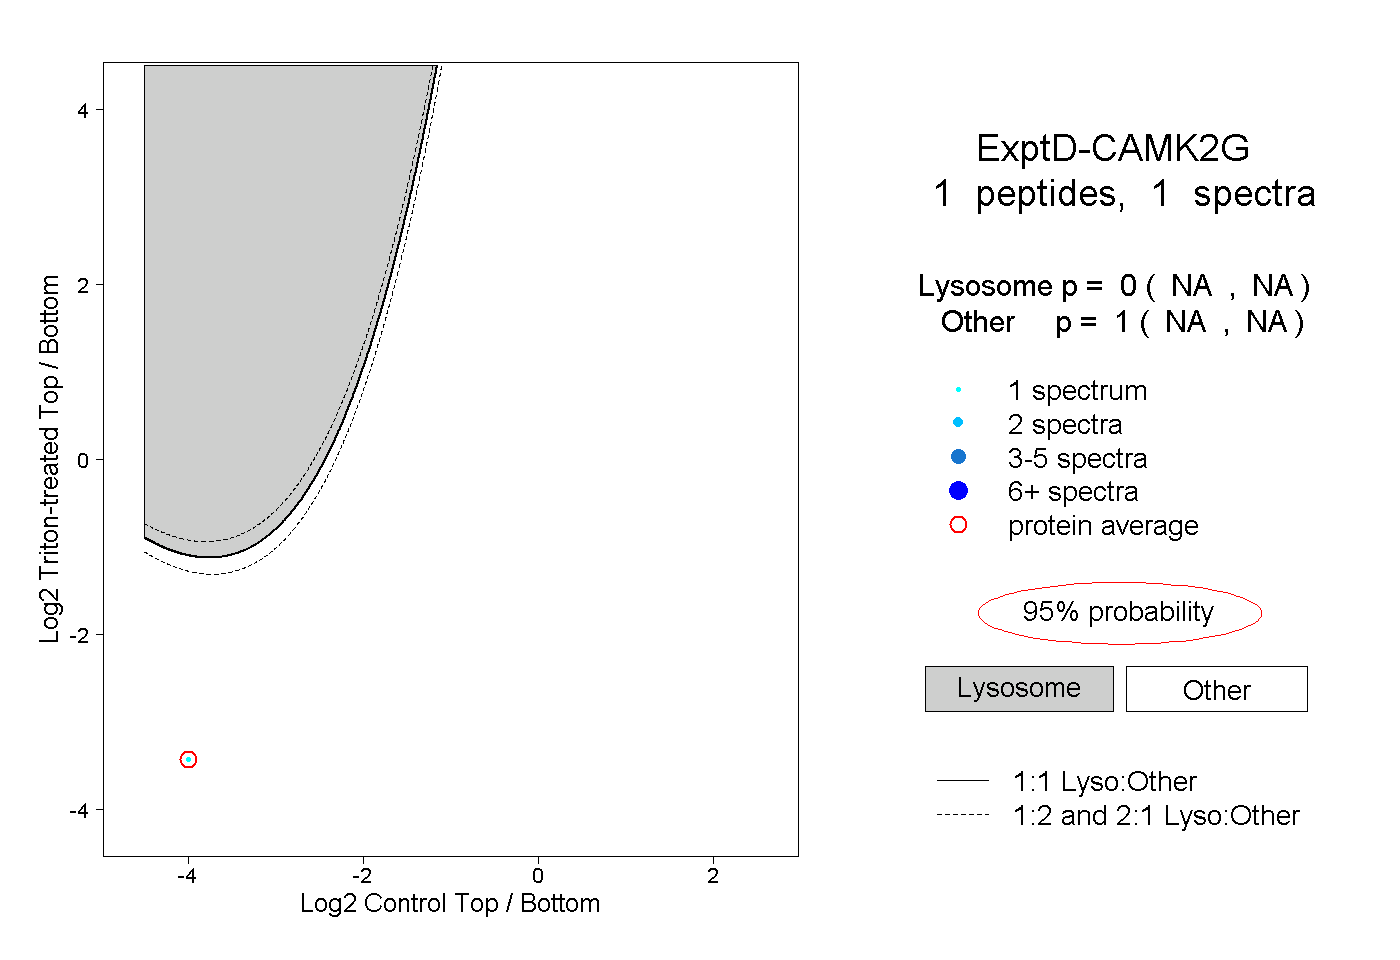 |
0.000 NA | NA |
1.000 NA | NA |