 3
3peptides
spectra
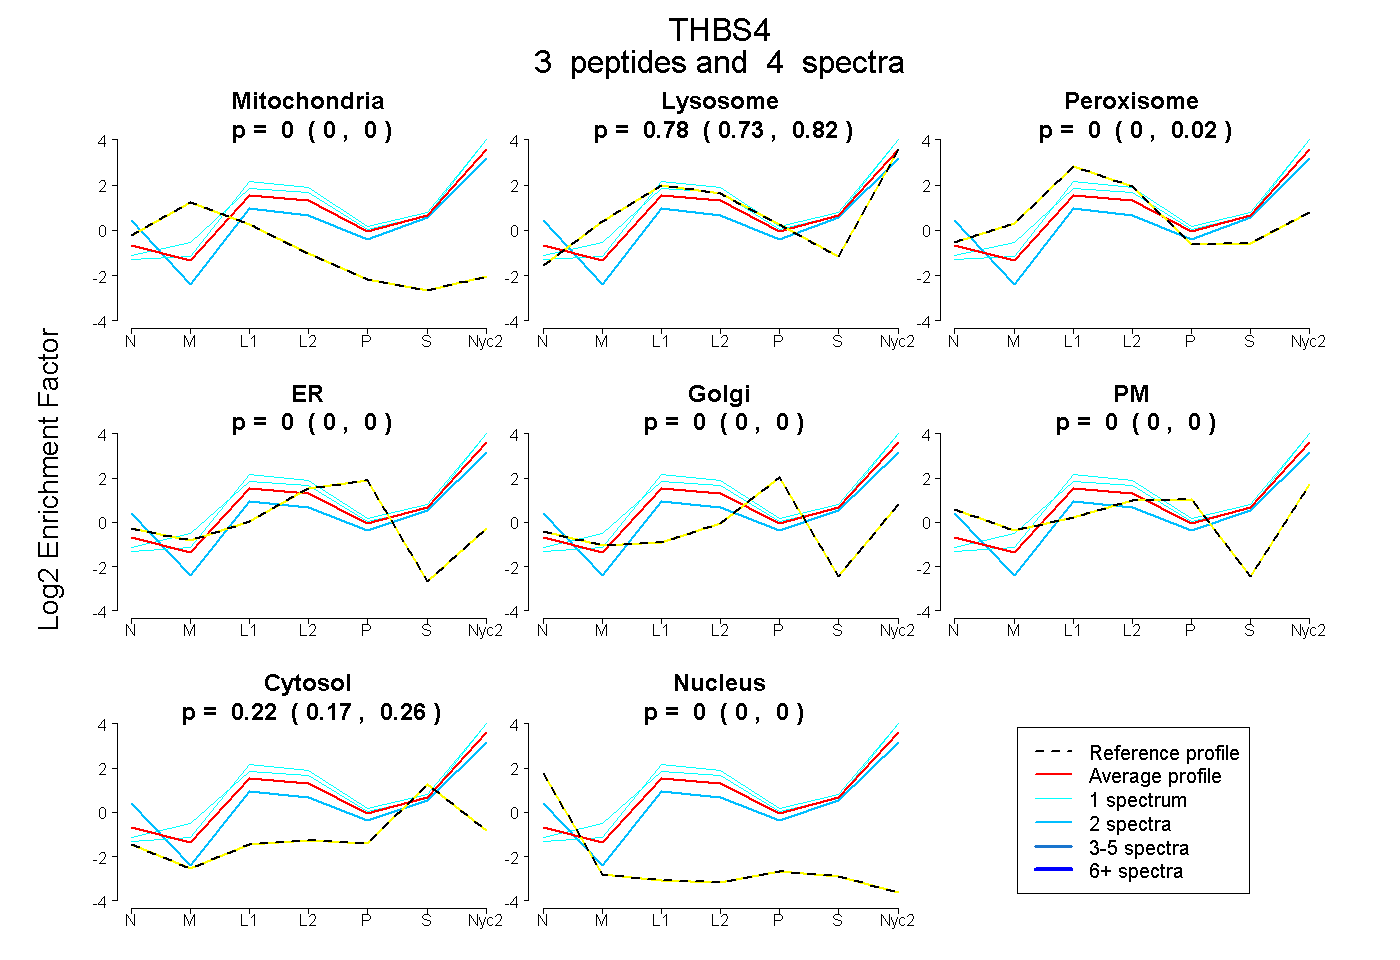
0.000 | 0.000
0.727 | 0.820
0.000 | 0.017
0.000 | 0.000
0.000 | 0.000
0.000 | 0.000
0.168 | 0.259
0.000 | 0.000
7peptides
spectra
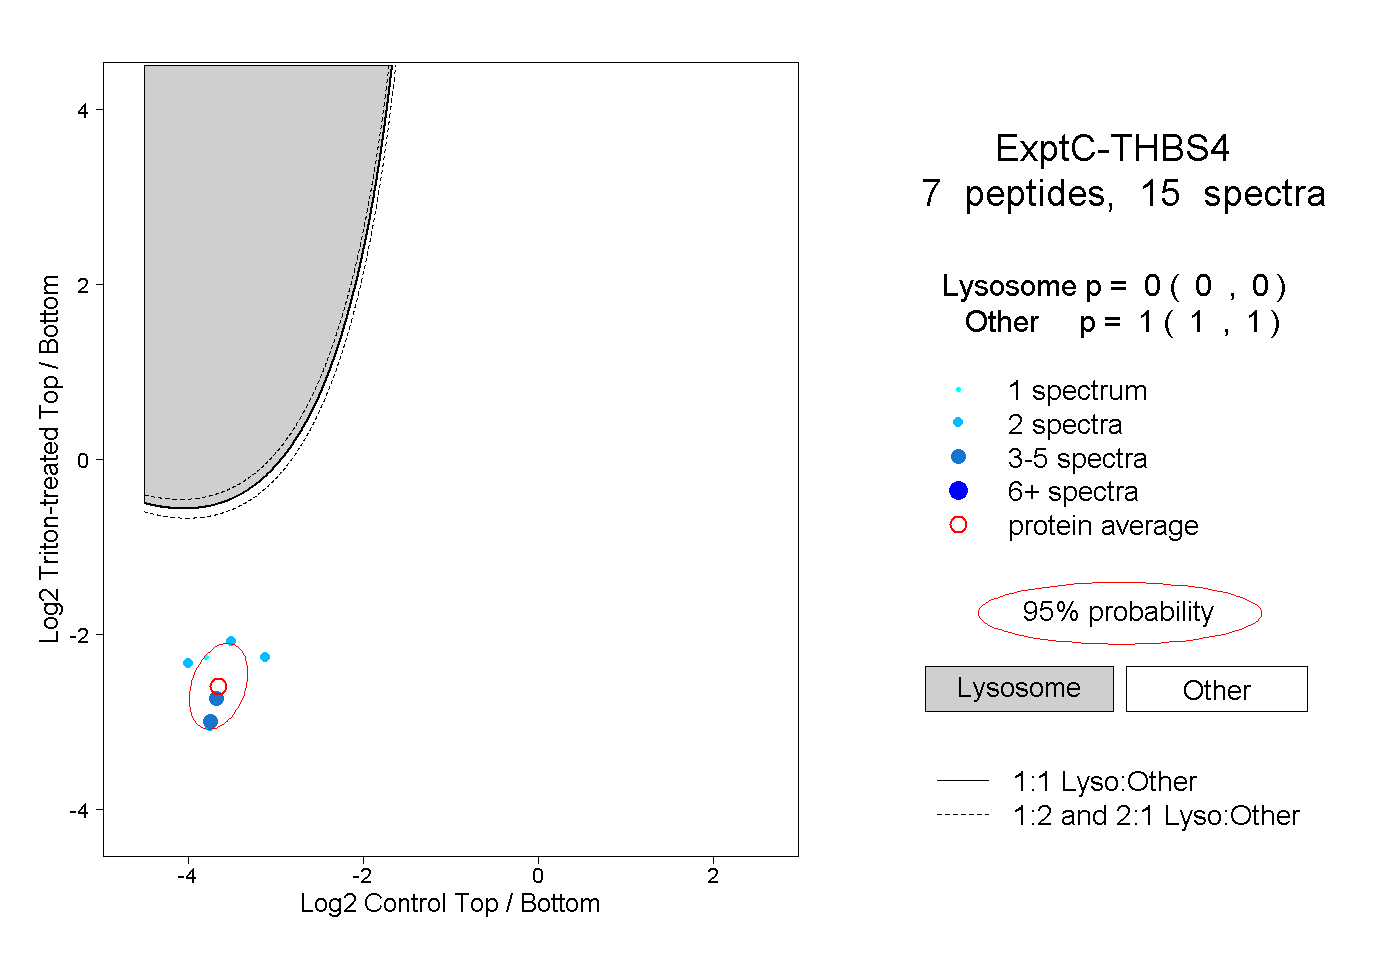
0.000 | 0.000
1.000 | 1.000
1peptide
spectrum
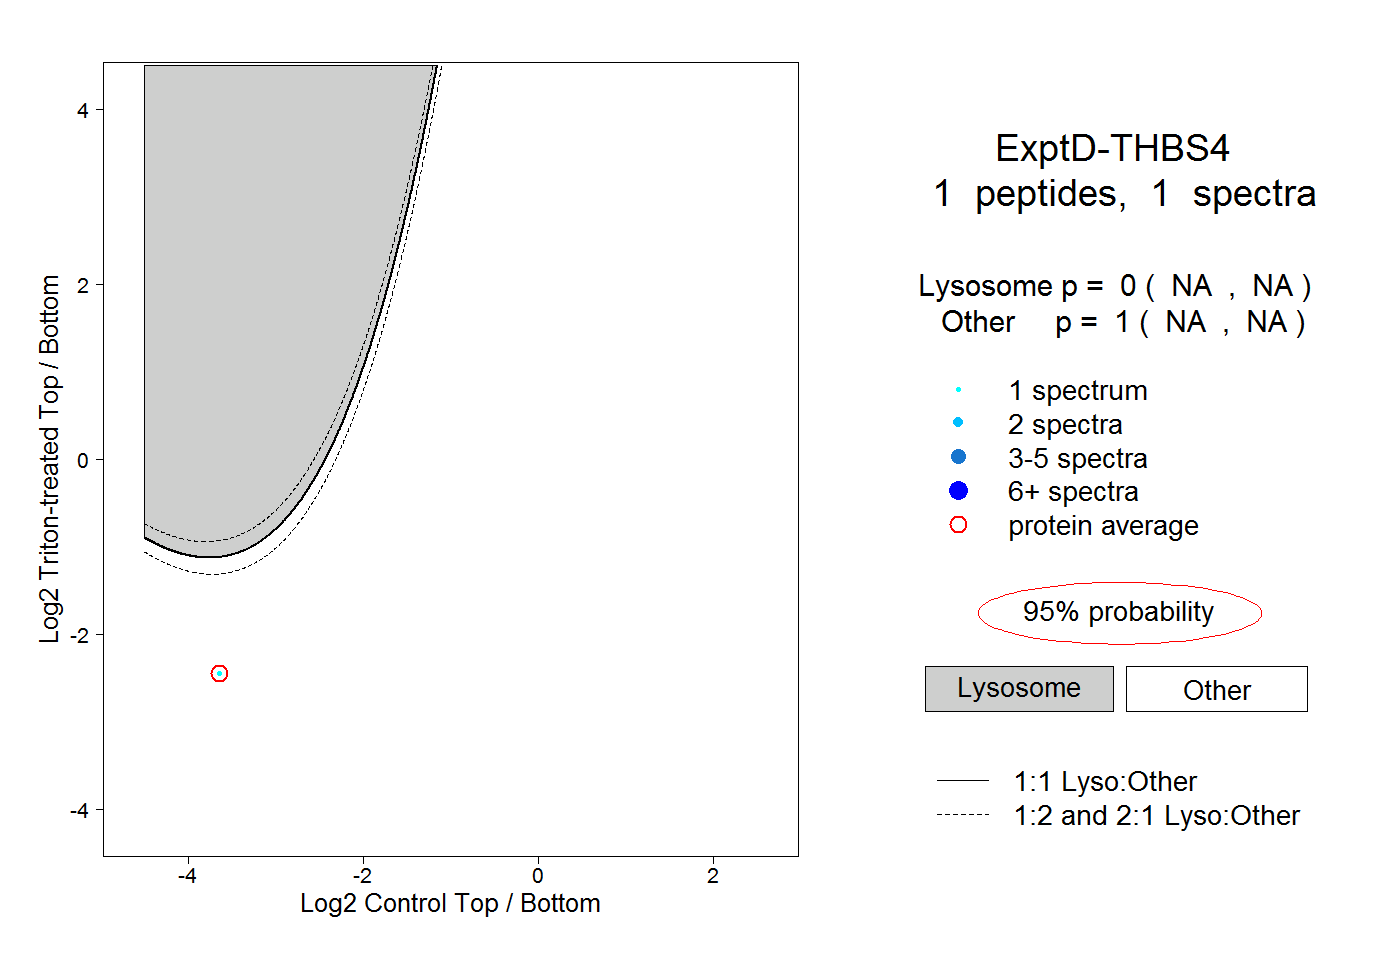
NA | NA
NA | NA