18
18peptides
spectra
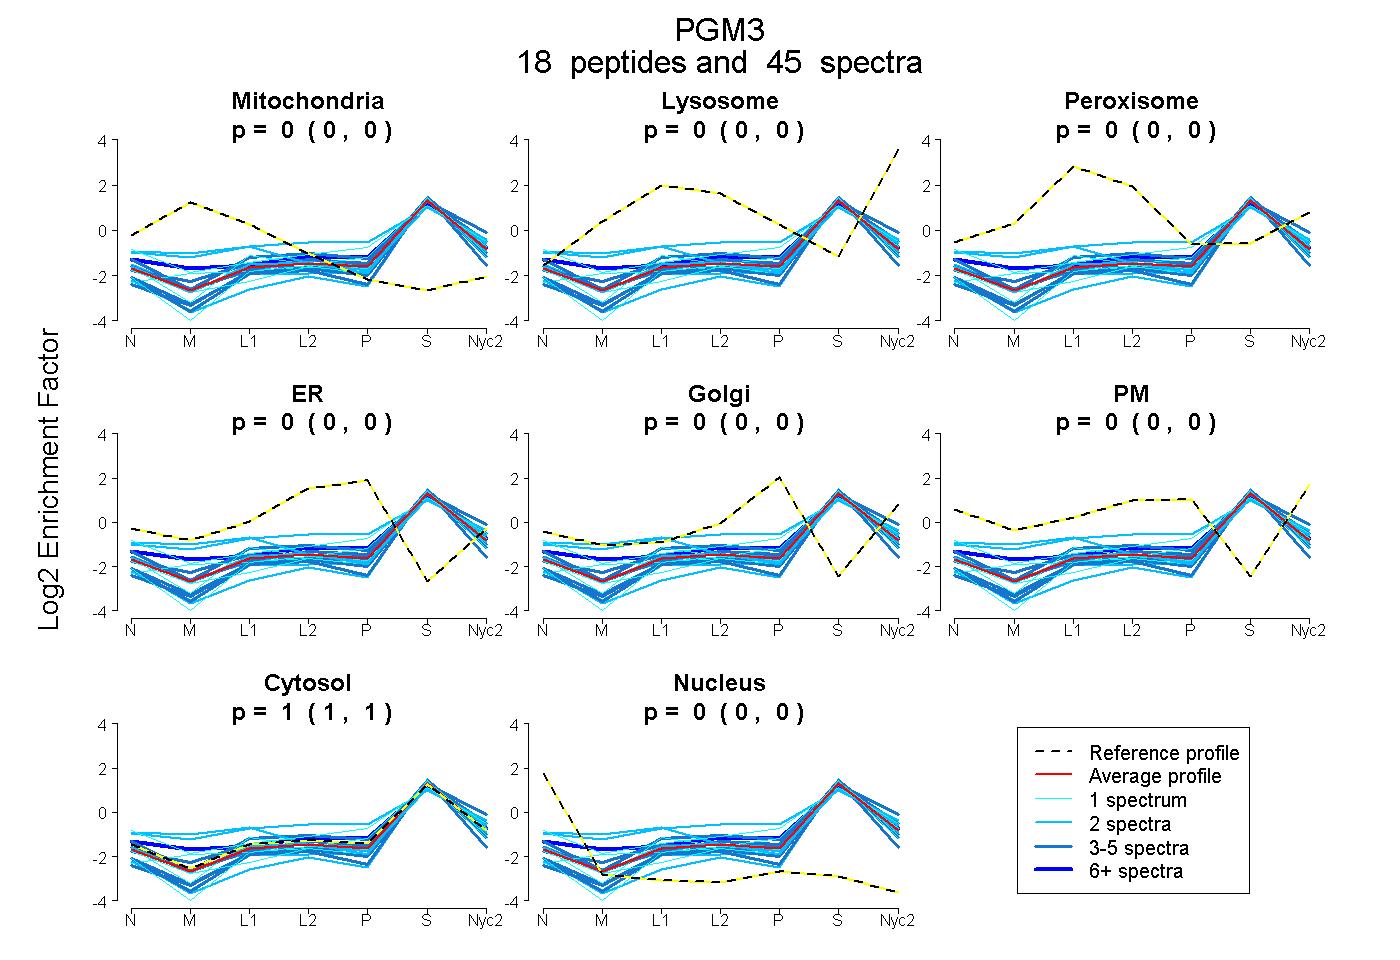
0.000 | 0.000
0.000 | 0.000
0.000 | 0.000
0.000 | 0.000
0.000 | 0.000
0.000 | 0.000
1.000 | 1.000
0.000 | 0.000
5peptides
spectra
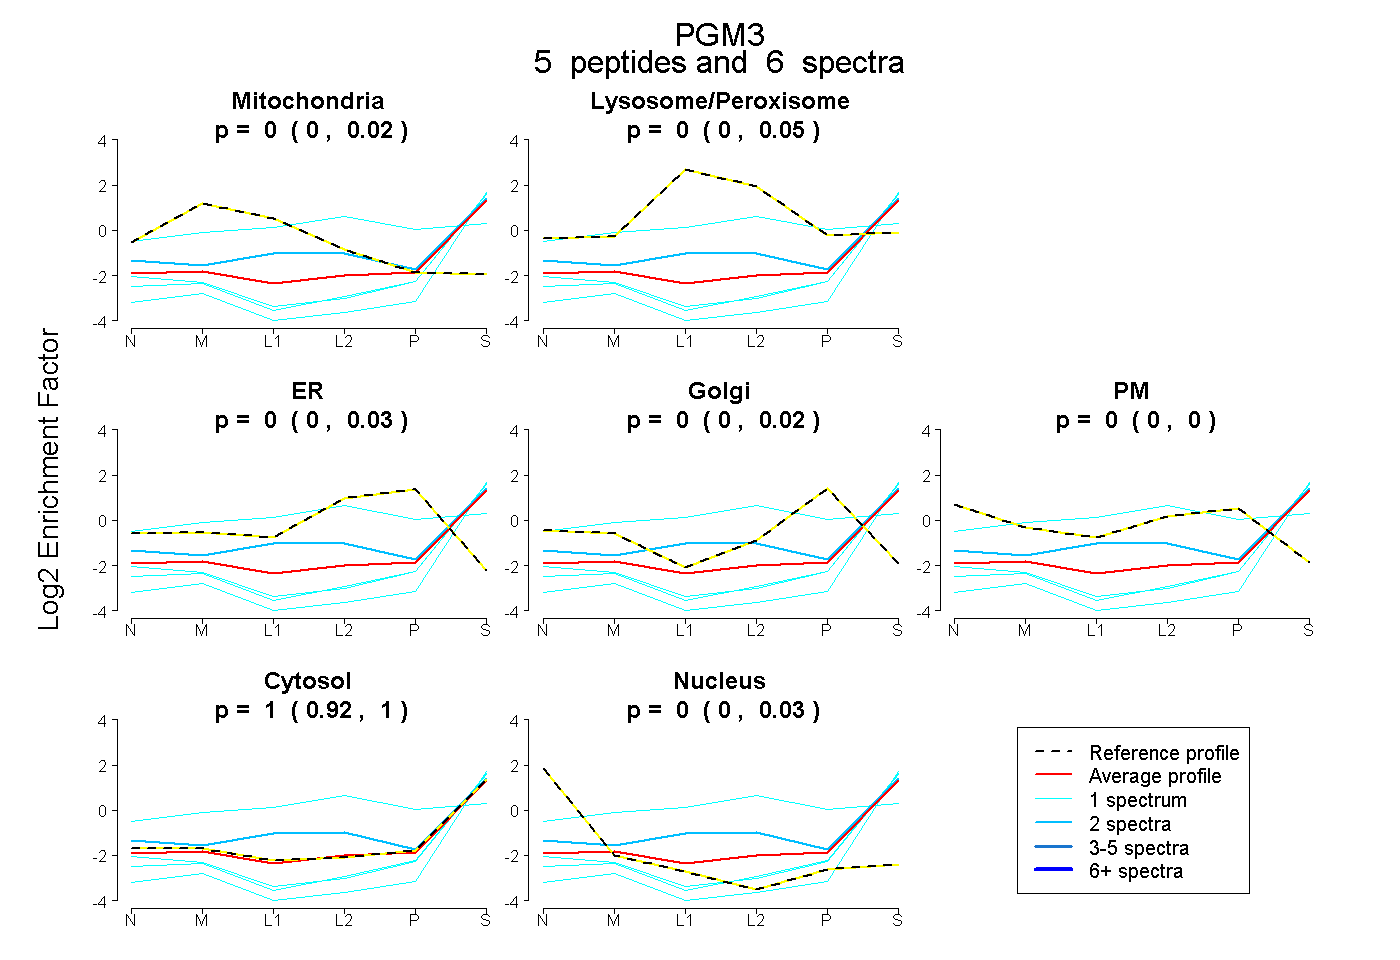
0.000 | 0.015
0.000 | 0.050
0.000 | 0.026
0.000 | 0.016
0.000 | 0.000
0.919 | 1.000
0.000 | 0.031
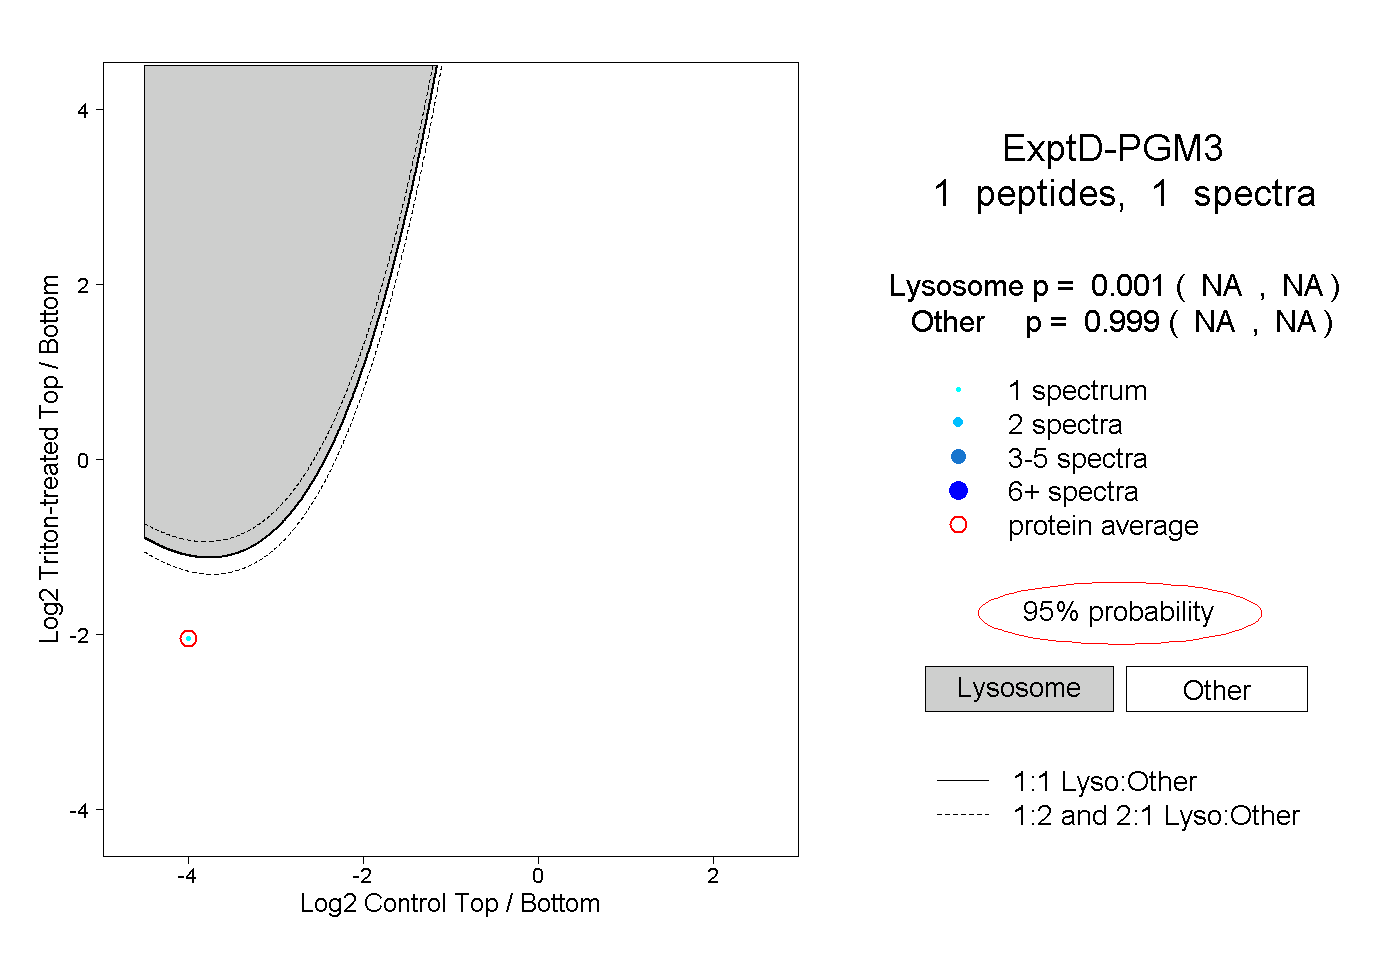
11peptides
spectra
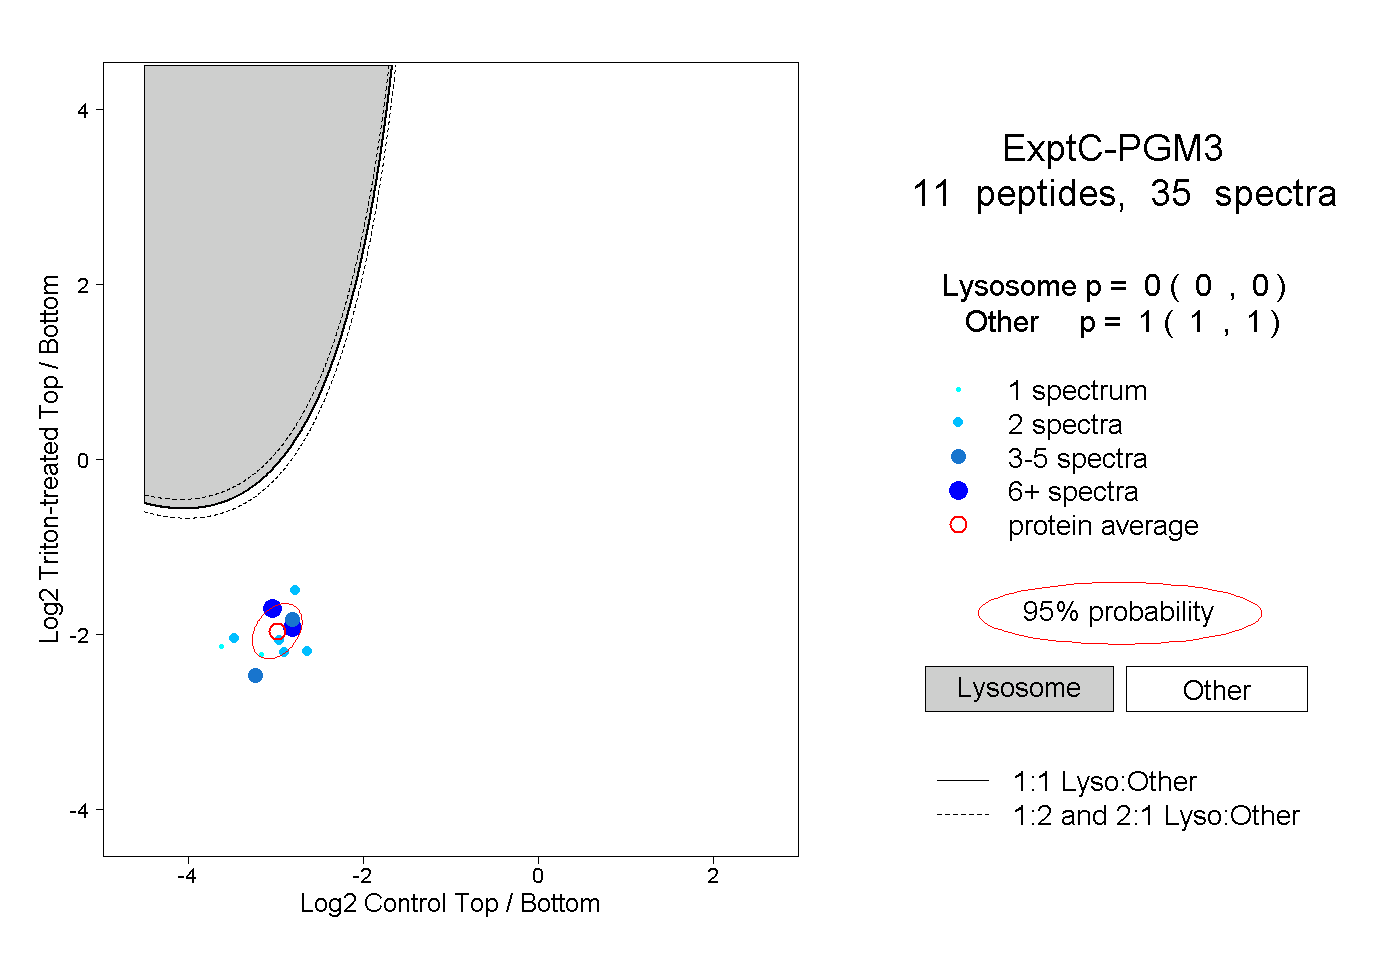
0.000 | 0.000
1.000 | 1.000