 2
2peptides
spectra
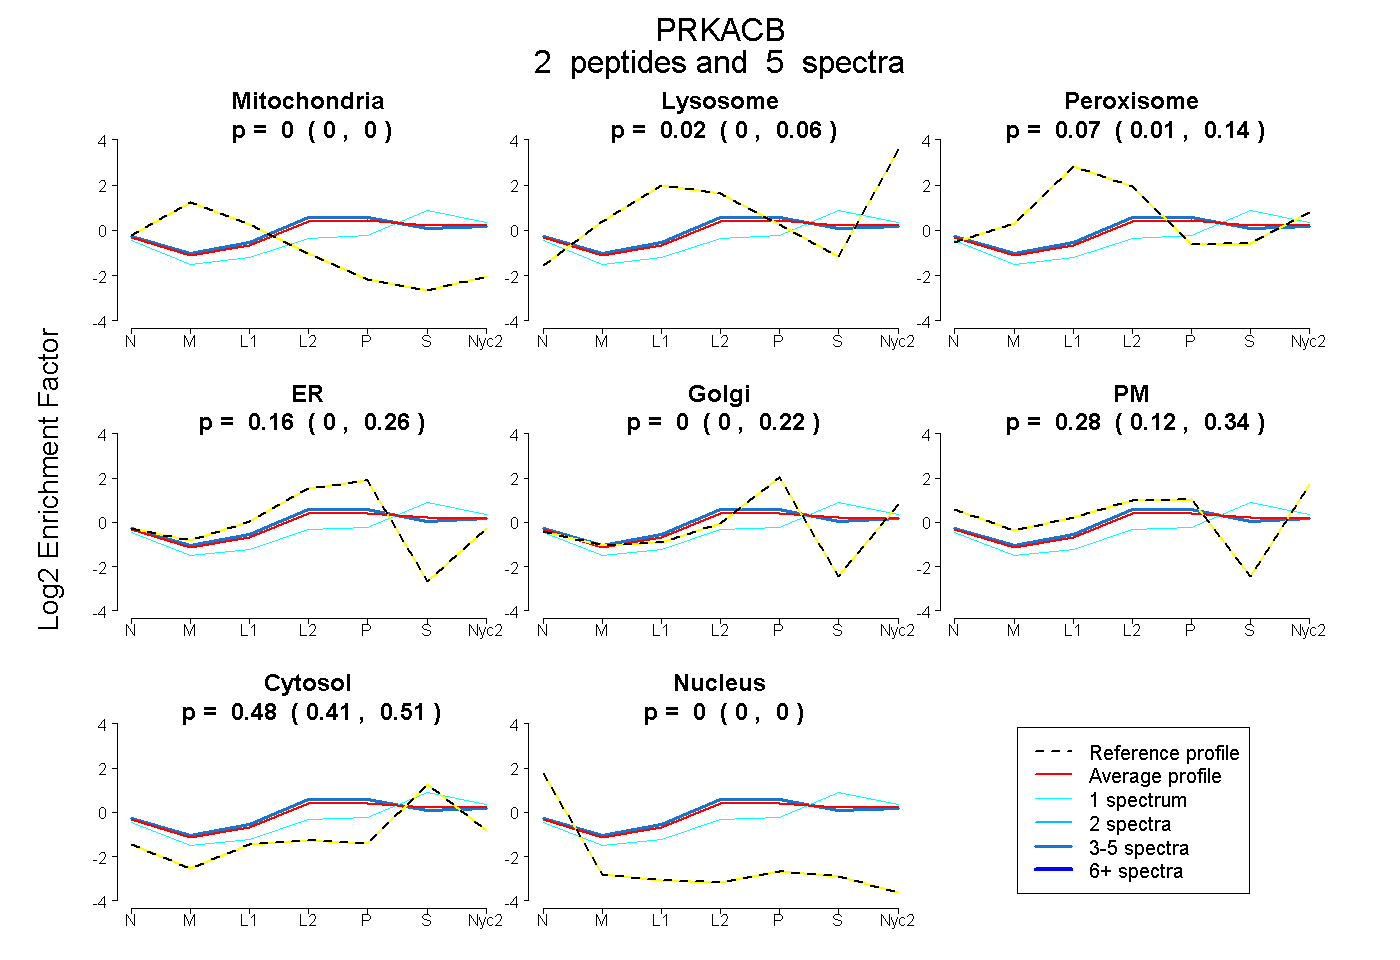
0.000 | 0.000
0.000 | 0.063
0.014 | 0.138
0.000 | 0.263
0.000 | 0.218
0.121 | 0.338
0.408 | 0.514
0.000 | 0.000
2peptides
spectra
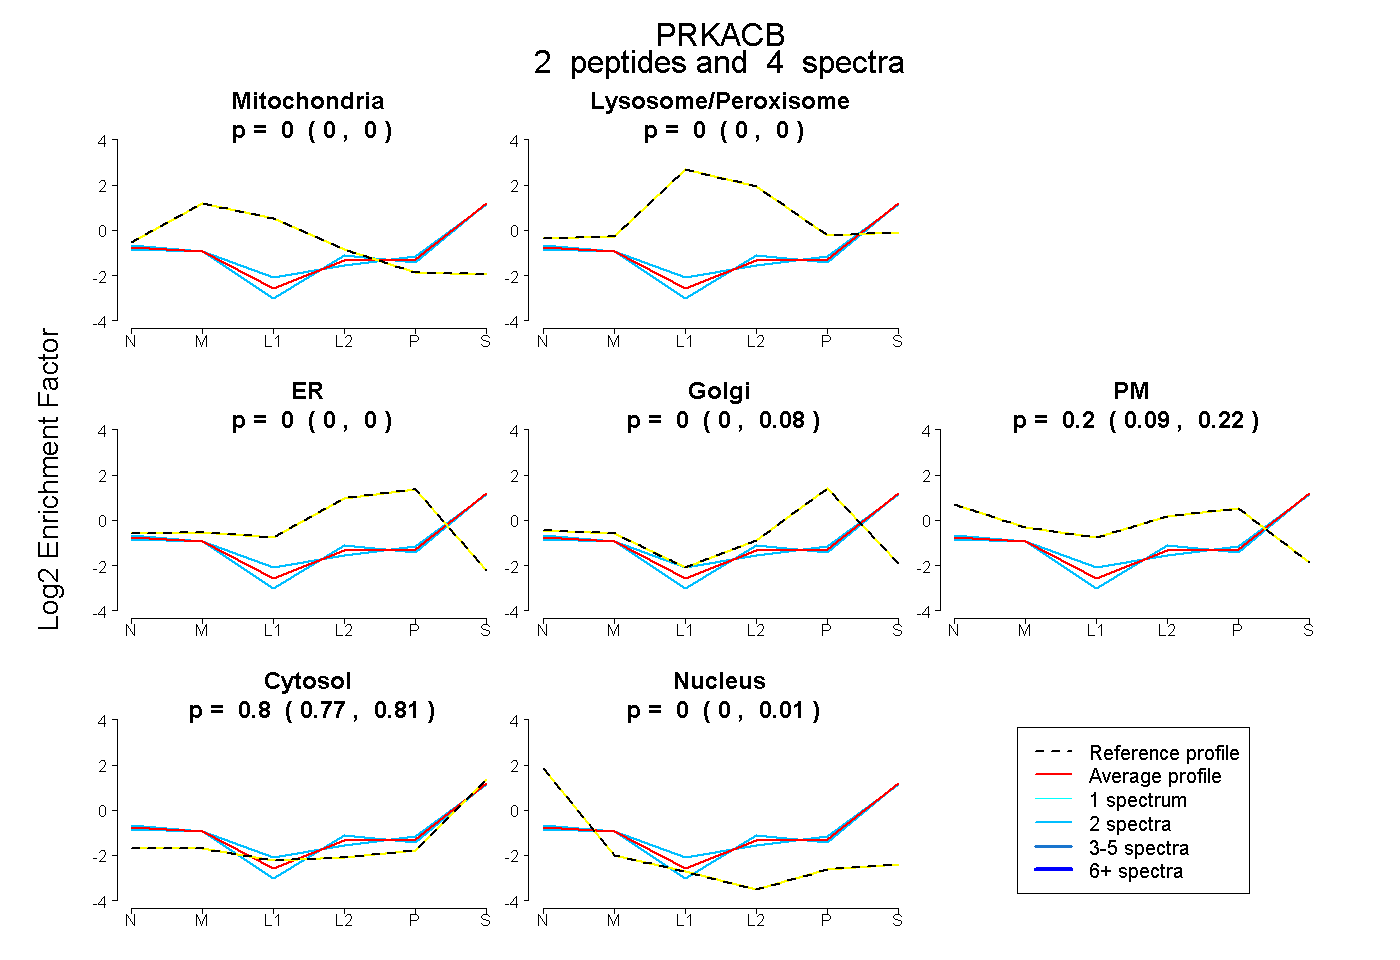
0.000 | 0.000
0.000 | 0.000
0.000 | 0.000
0.000 | 0.080
0.093 | 0.222
0.770 | 0.812
0.000 | 0.014
3peptides
spectra
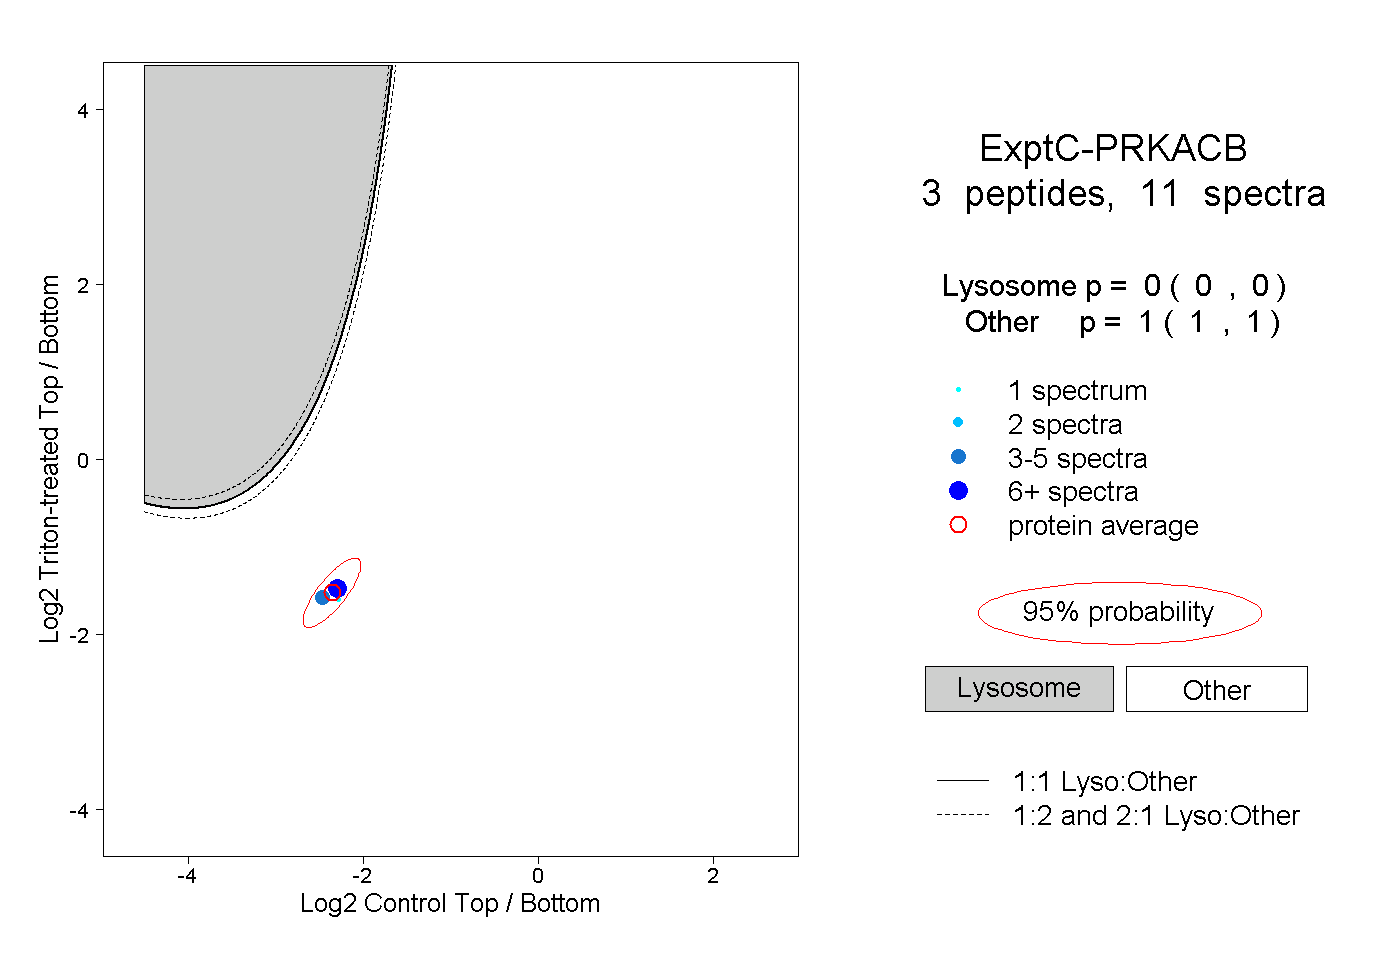
0.000 | 0.000
1.000 | 1.000
1peptide
spectrum
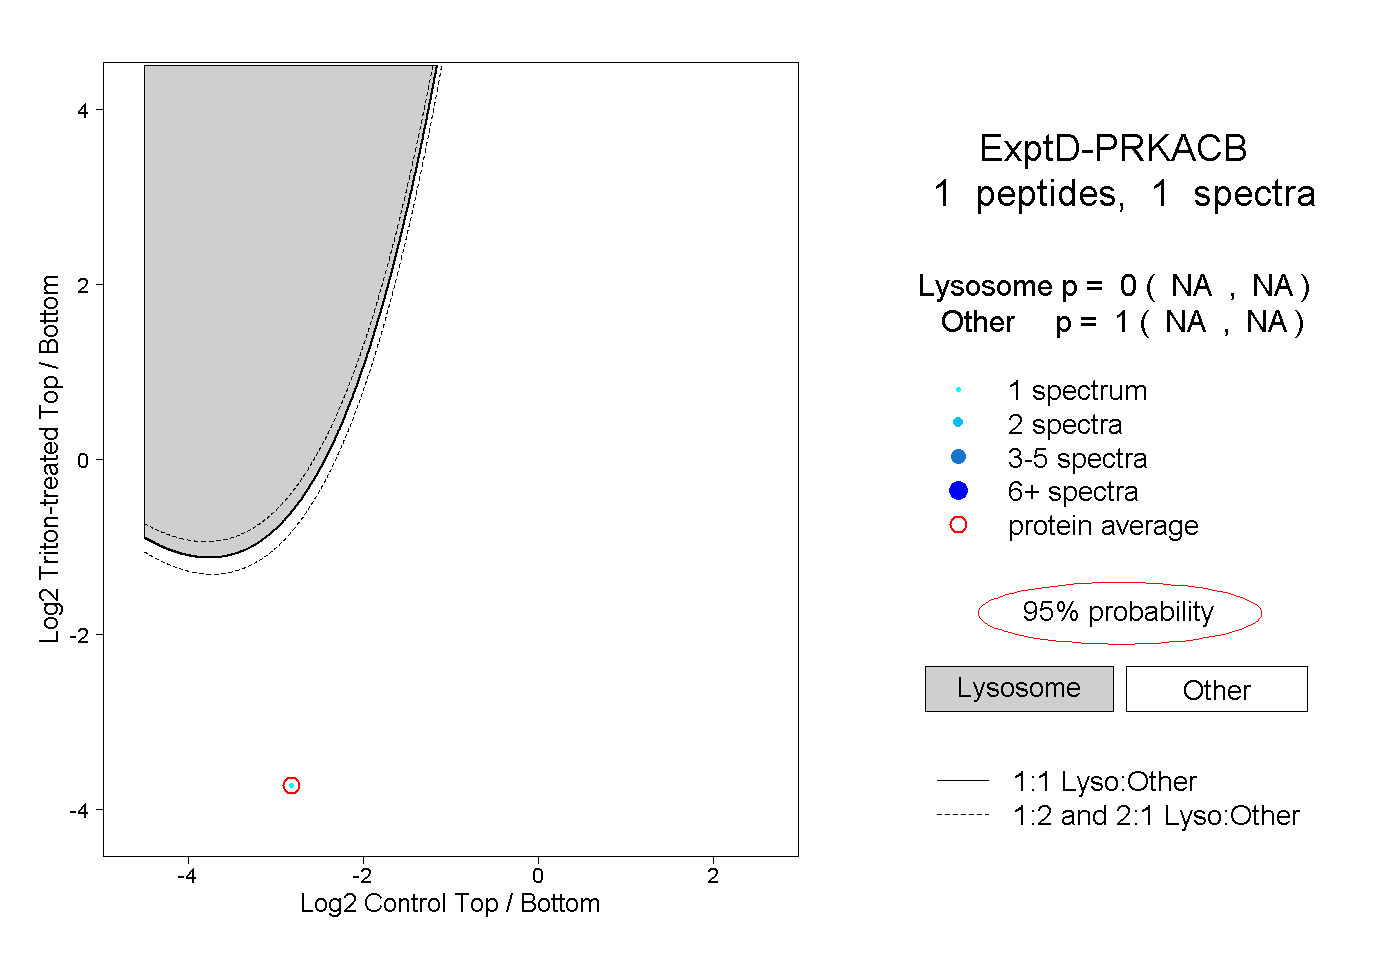
NA | NA
NA | NA