 35
35peptides
spectra
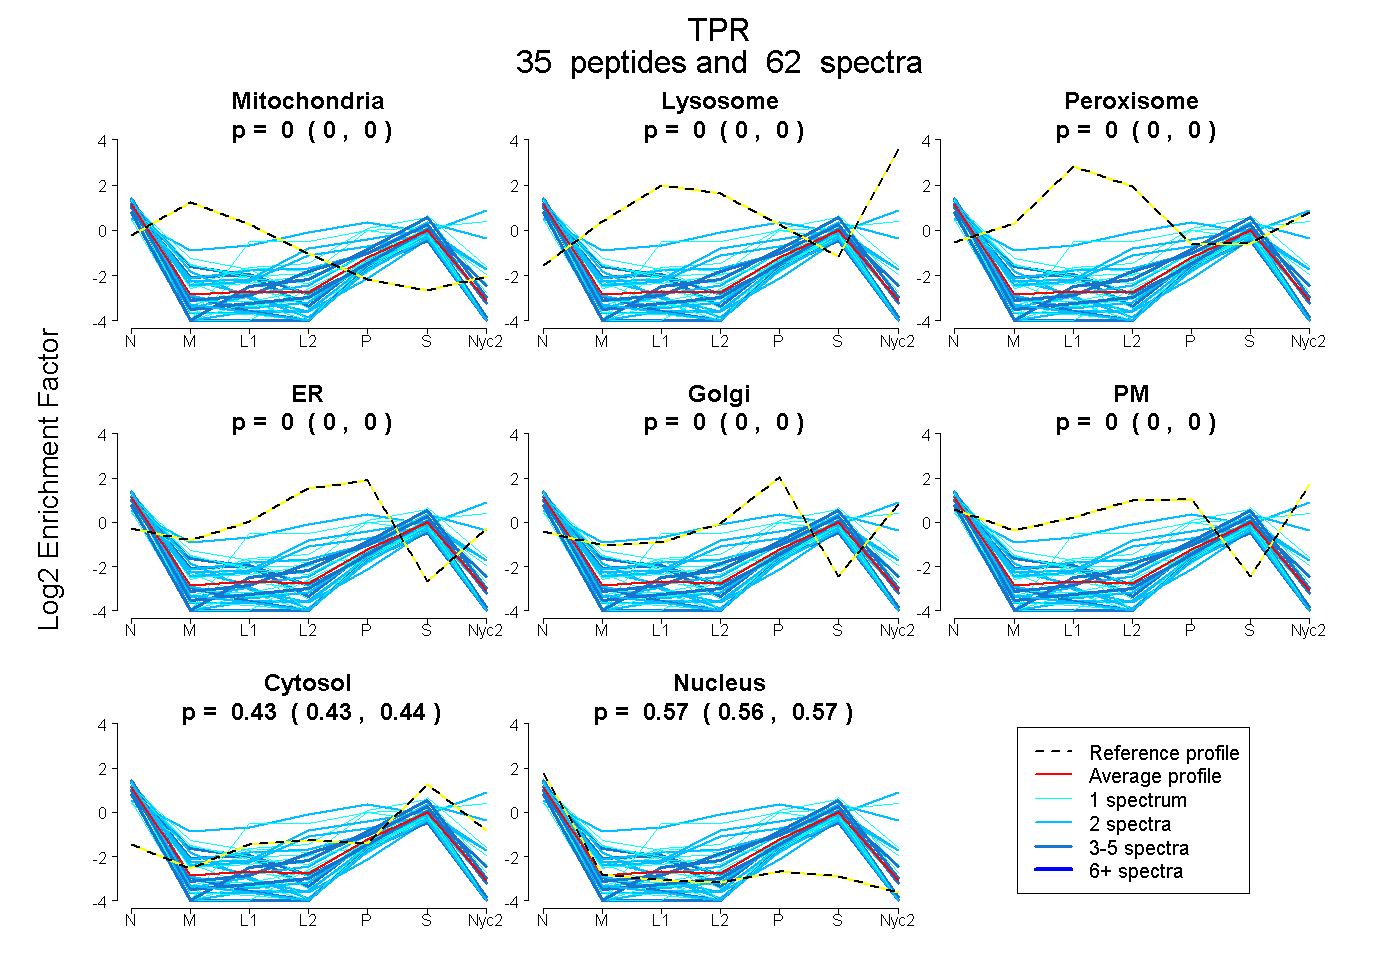
0.000 | 0.000
0.000 | 0.000
0.000 | 0.000
0.000 | 0.000
0.000 | 0.000
0.000 | 0.000
0.428 | 0.437
0.563 | 0.571
5peptides
spectra
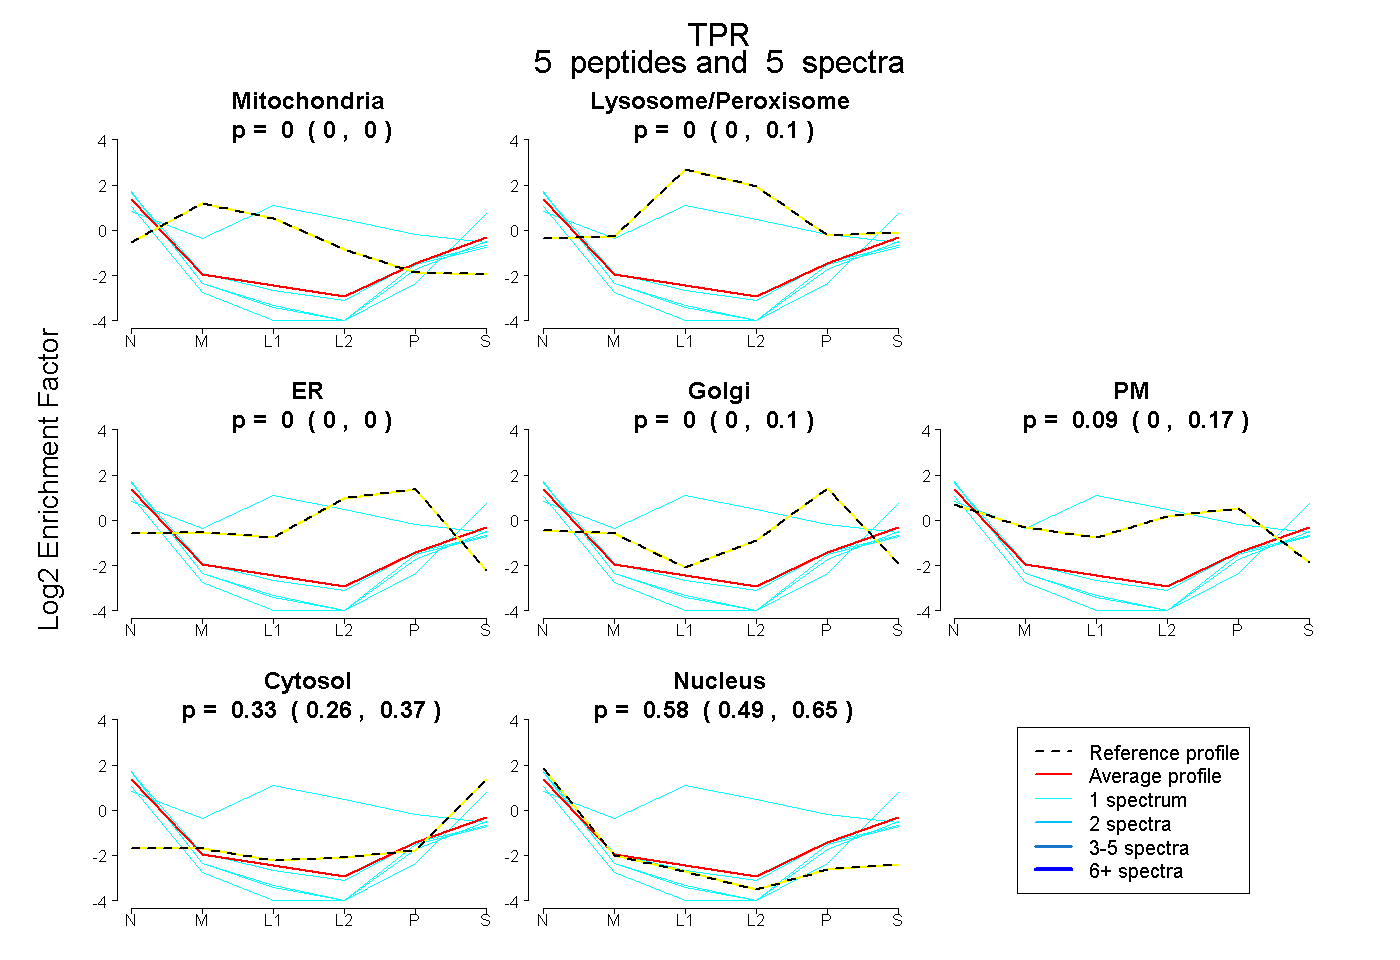
0.000 | 0.000
0.000 | 0.097
0.000 | 0.000
0.000 | 0.103
0.000 | 0.166
0.255 | 0.367
0.487 | 0.653
3peptides
spectra
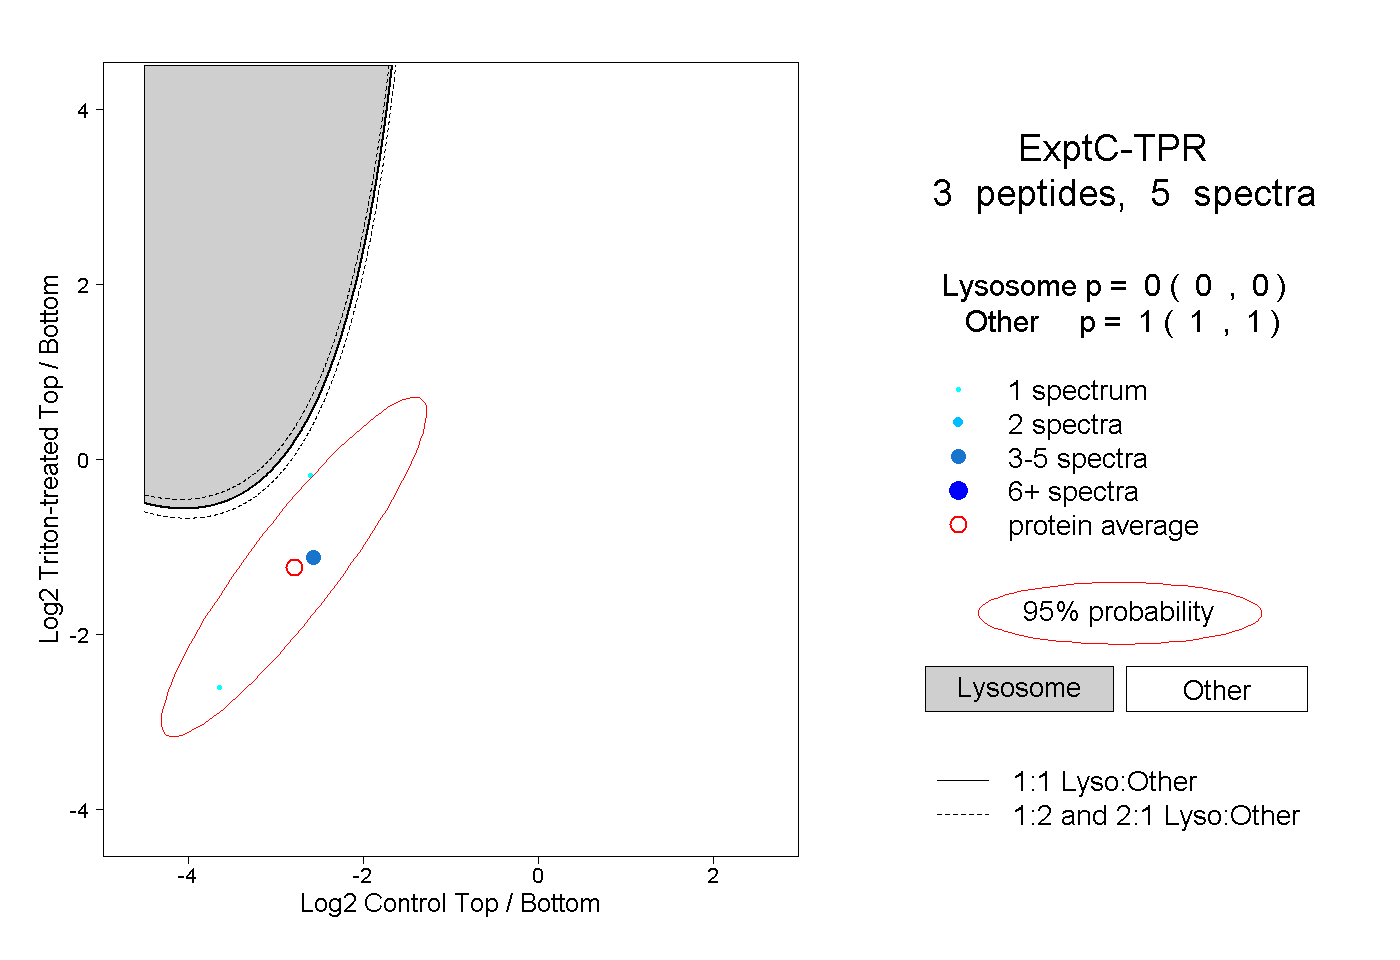
0.000 | 0.000
1.000 | 1.000