 21
21peptides
spectra
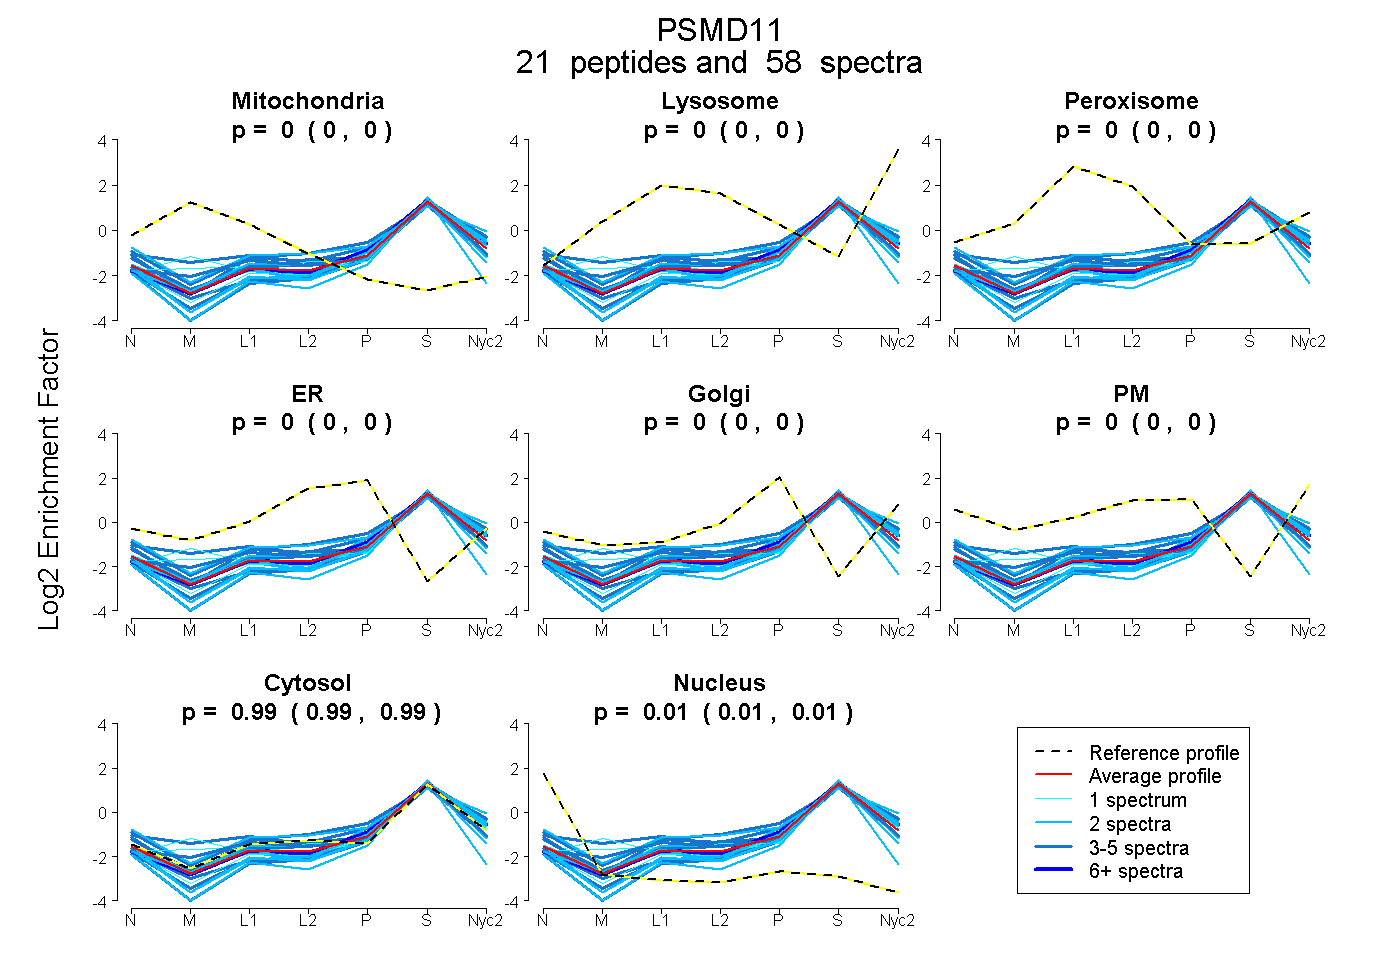
0.000 | 0.000
0.000 | 0.000
0.000 | 0.000
0.000 | 0.000
0.000 | 0.000
0.000 | 0.000
0.986 | 0.991
0.008 | 0.013
7peptides
spectra
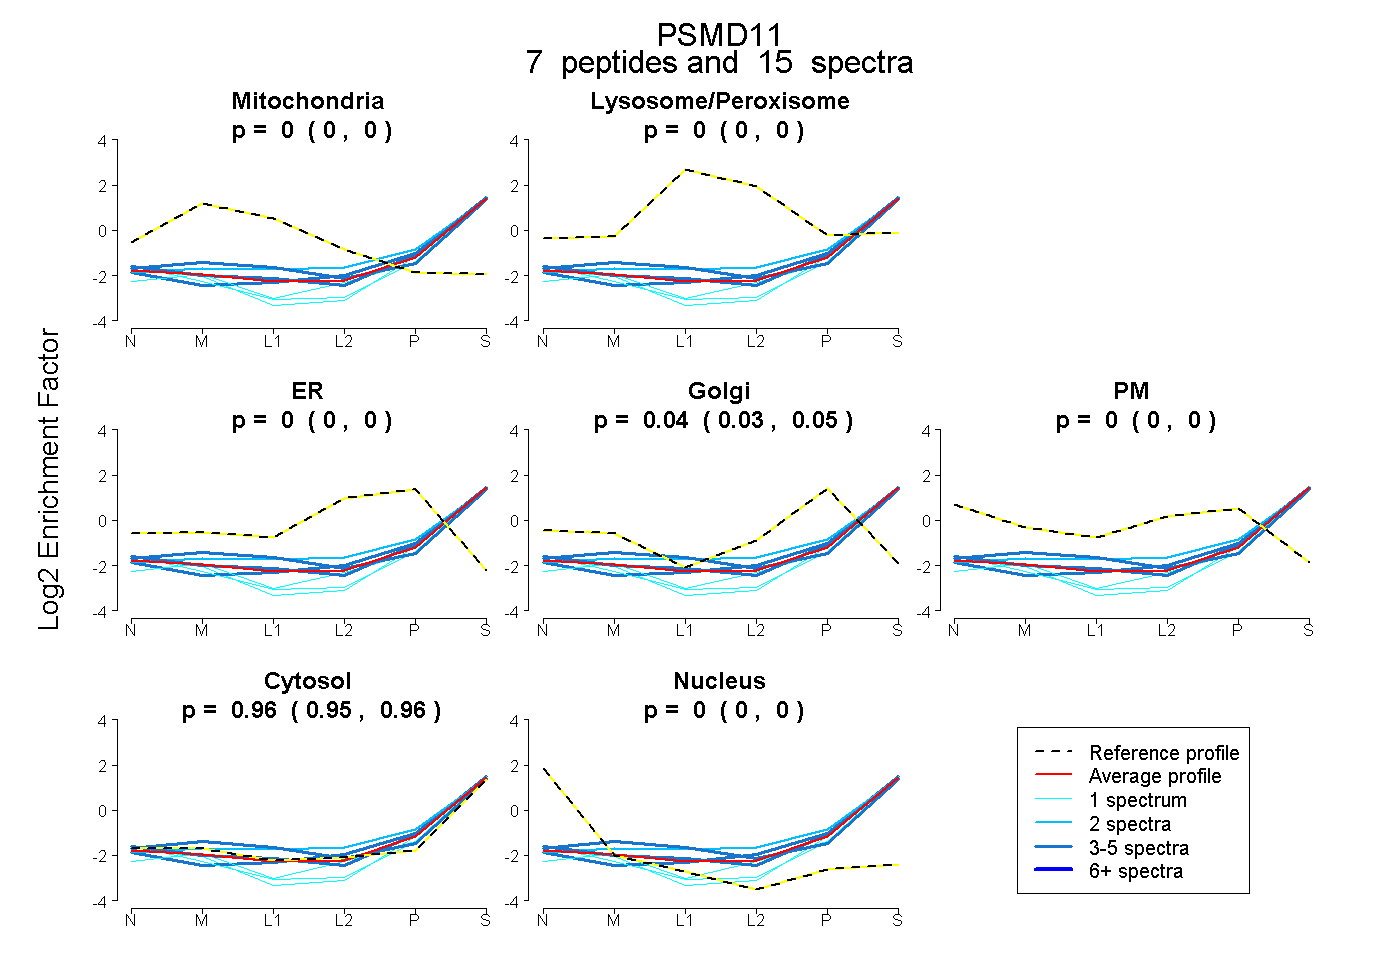
0.000 | 0.000
0.000 | 0.000
0.000 | 0.000
0.035 | 0.050
0.000 | 0.000
0.949 | 0.963
0.000 | 0.000
13peptides
spectra
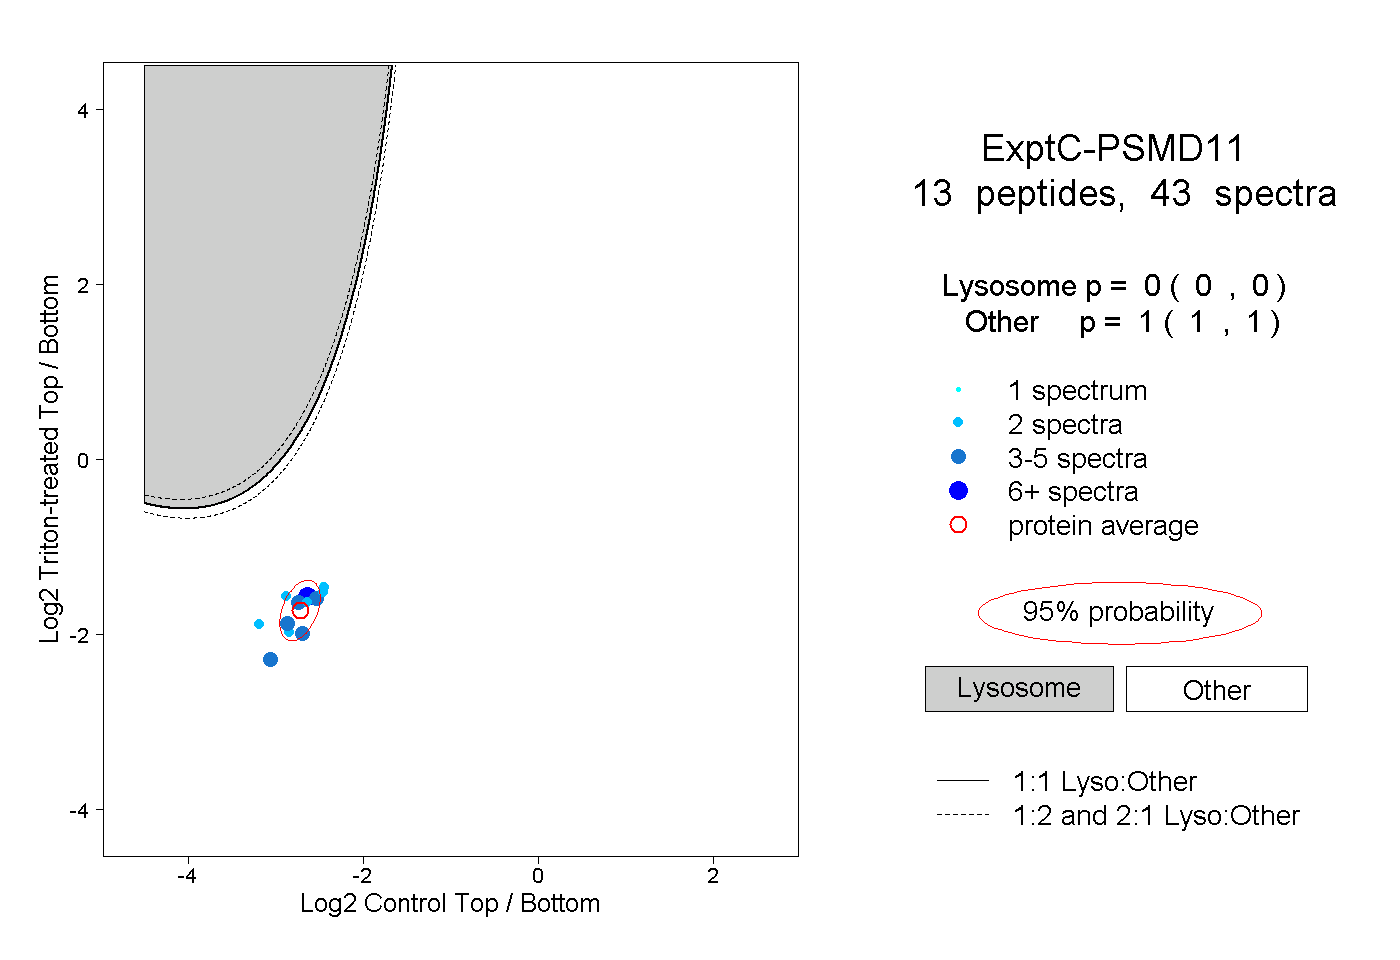
0.000 | 0.000
1.000 | 1.000
1peptide
spectrum
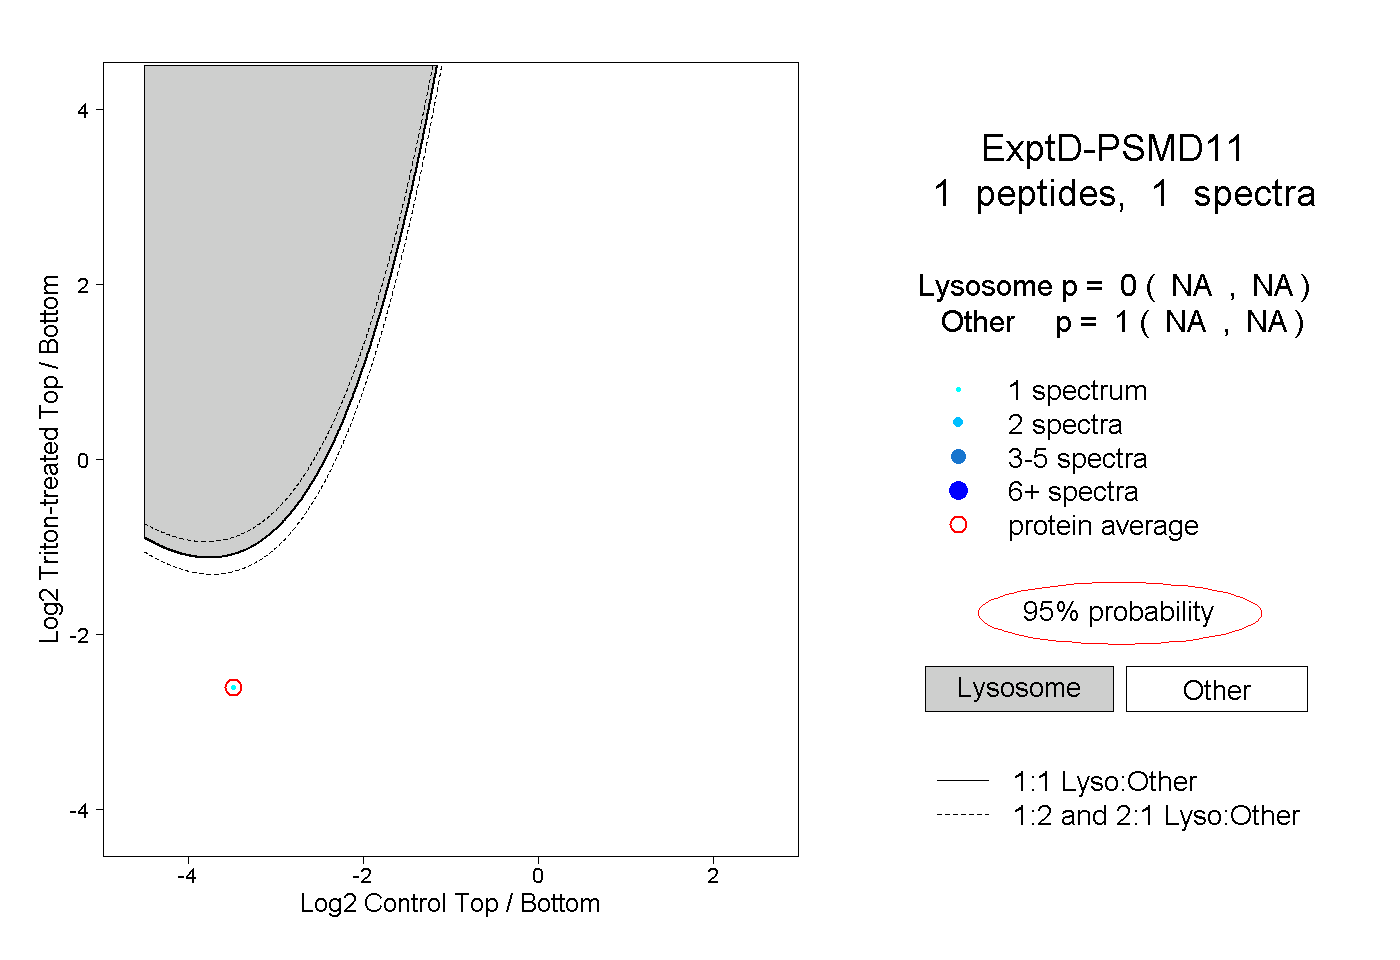
NA | NA
NA | NA