 1
1peptide
spectra

0.000 | 0.000
0.001 | 0.041
0.000 | 0.008
0.000 | 0.019
0.091 | 0.189
0.000 | 0.054
0.786 | 0.830
0.000 | 0.000
1peptide
spectra

0.000 | 0.000
1.000 | 1.000
1peptide
spectra
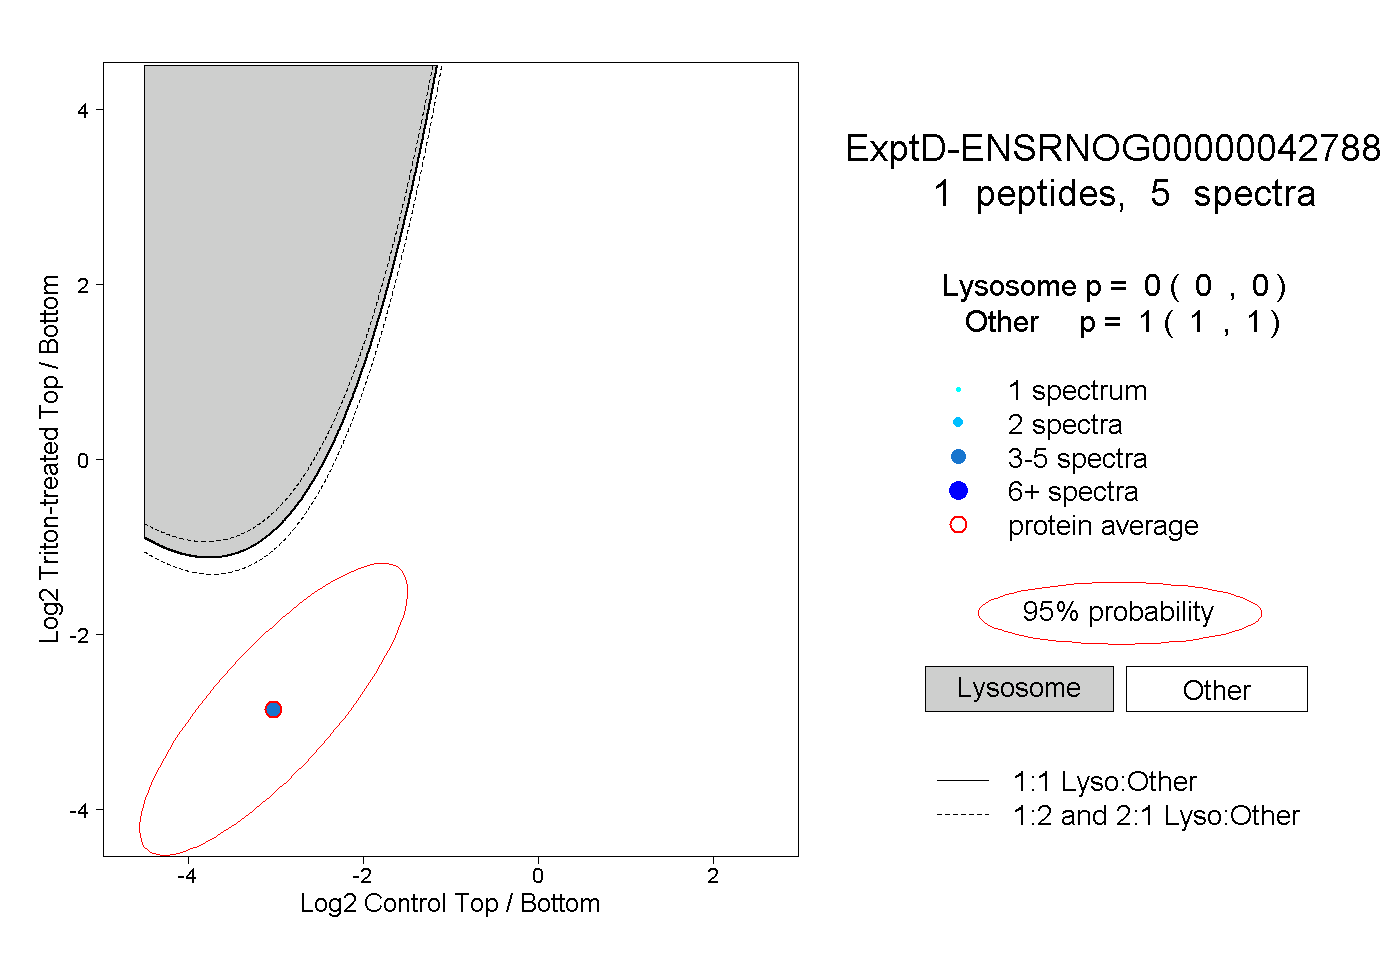
0.000 | 0.000
1.000 | 1.000