 1
1peptide
spectra
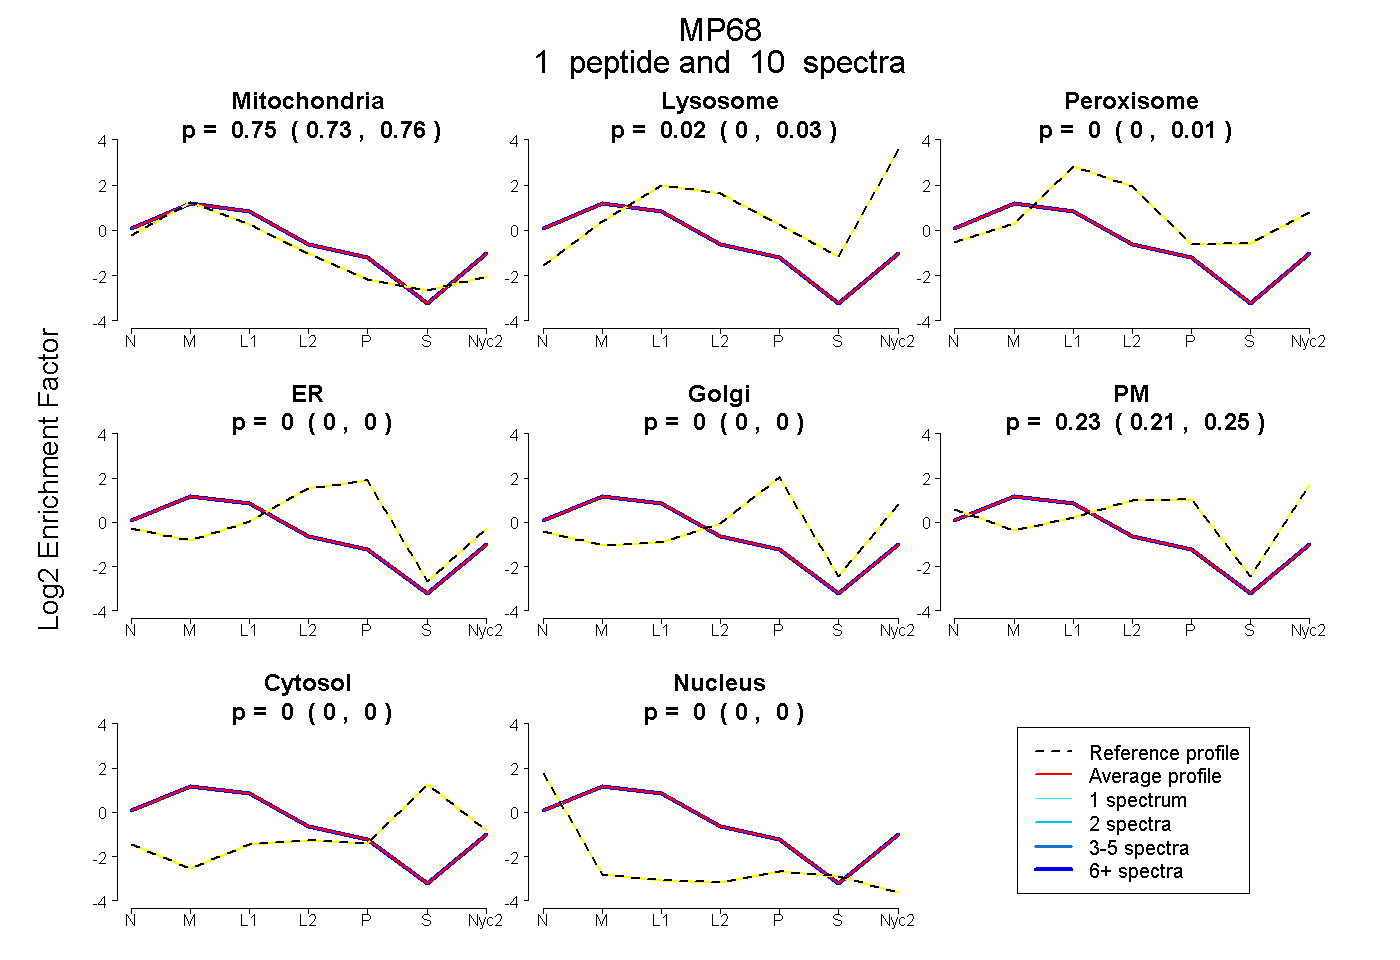
0.735 | 0.764
0.000 | 0.032
0.000 | 0.012
0.000 | 0.000
0.000 | 0.000
0.209 | 0.251
0.000 | 0.000
0.000 | 0.000
1peptide
spectra
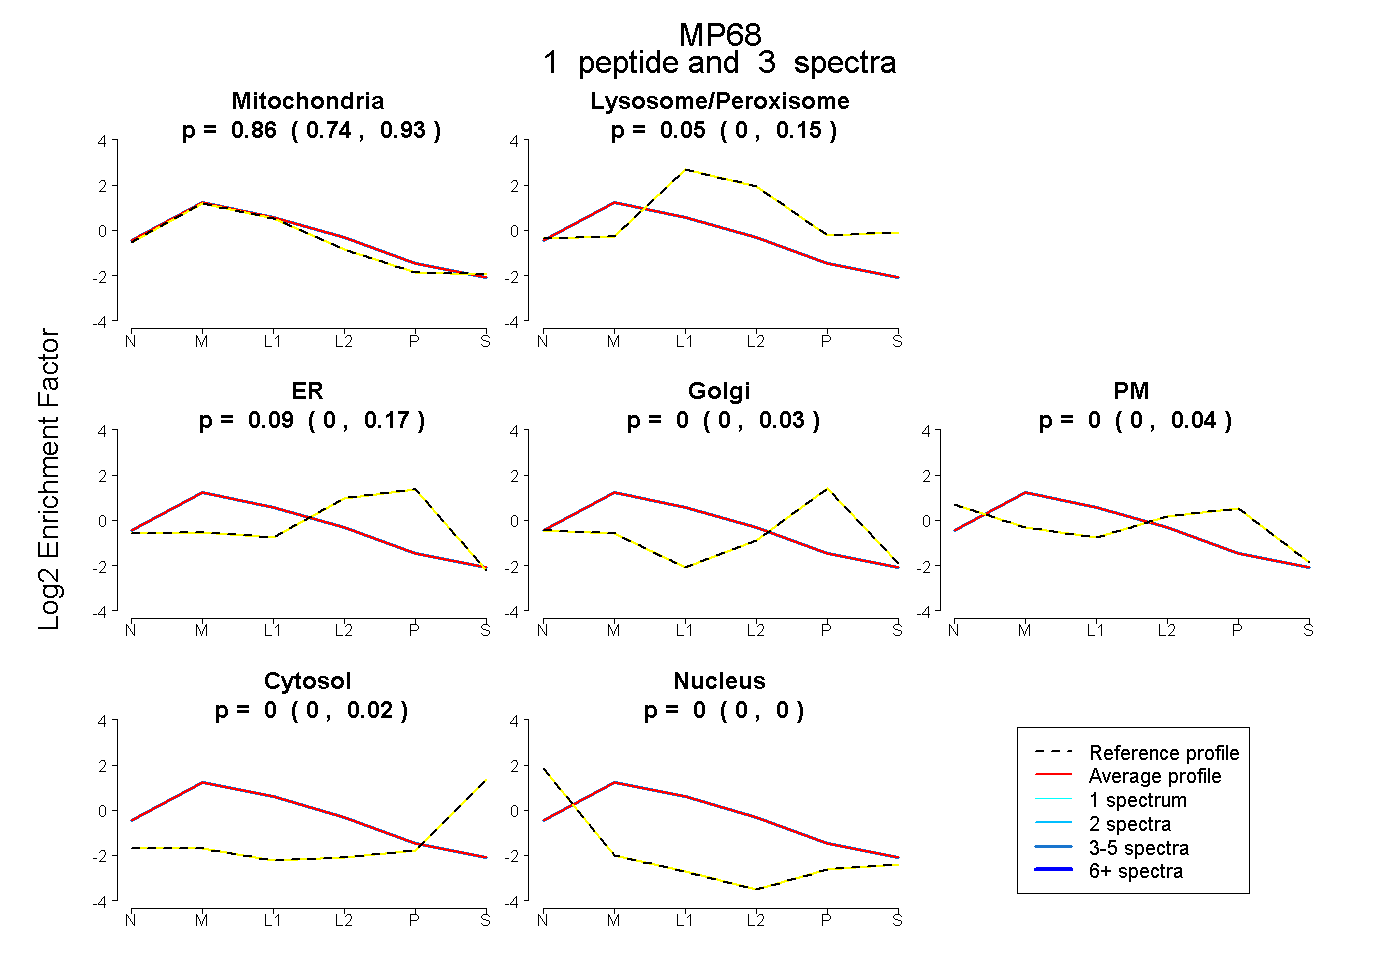
0.744 | 0.935
0.000 | 0.146
0.000 | 0.170
0.000 | 0.034
0.000 | 0.042
0.000 | 0.018
0.000 | 0.000
2peptides
spectra
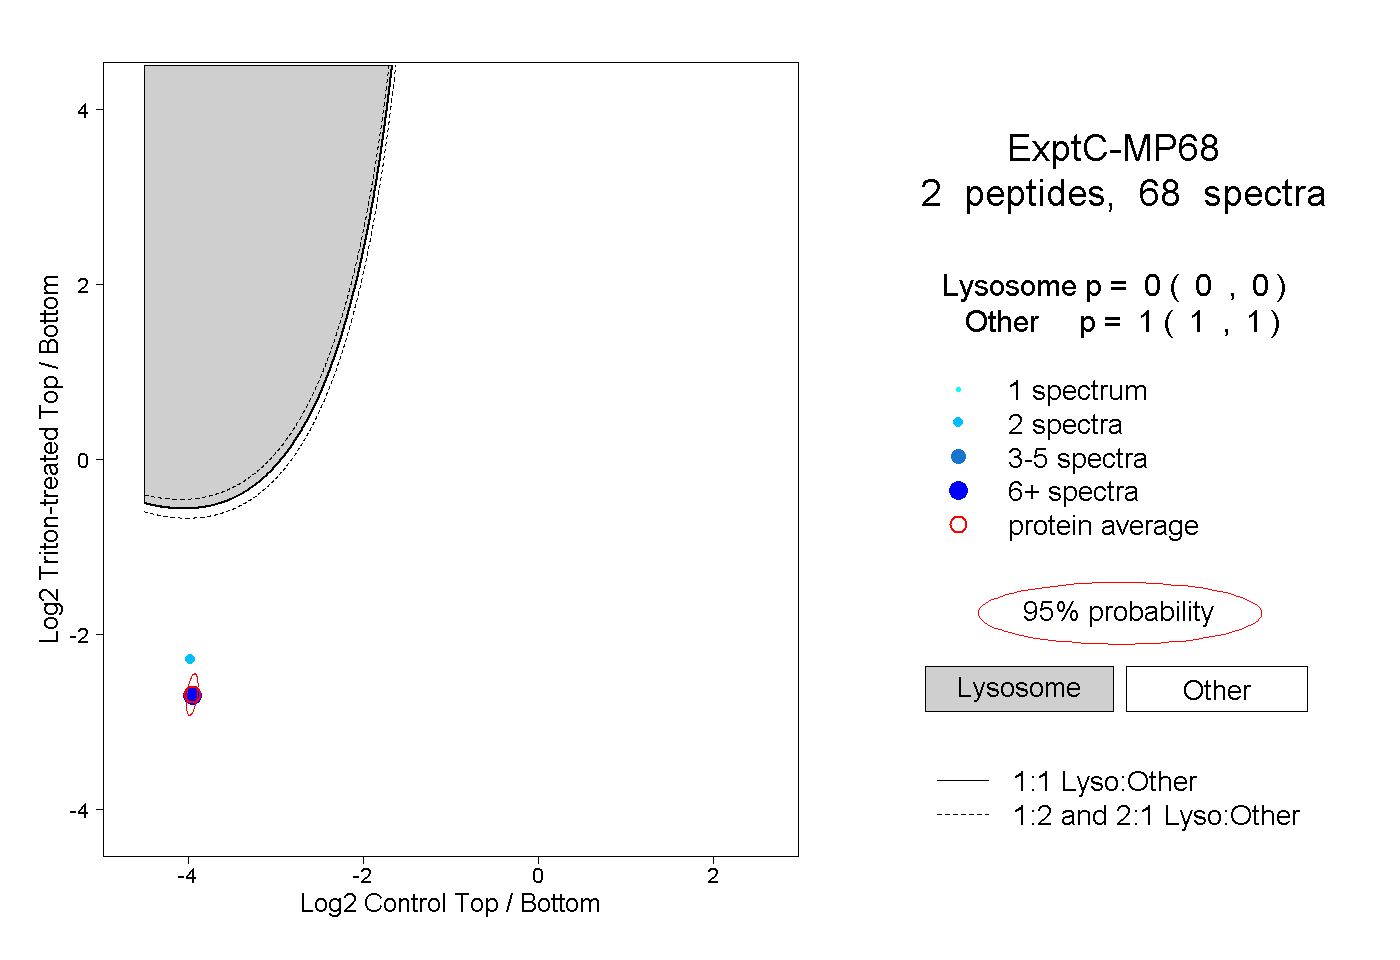
0.000 | 0.000
1.000 | 1.000
1peptide
spectra
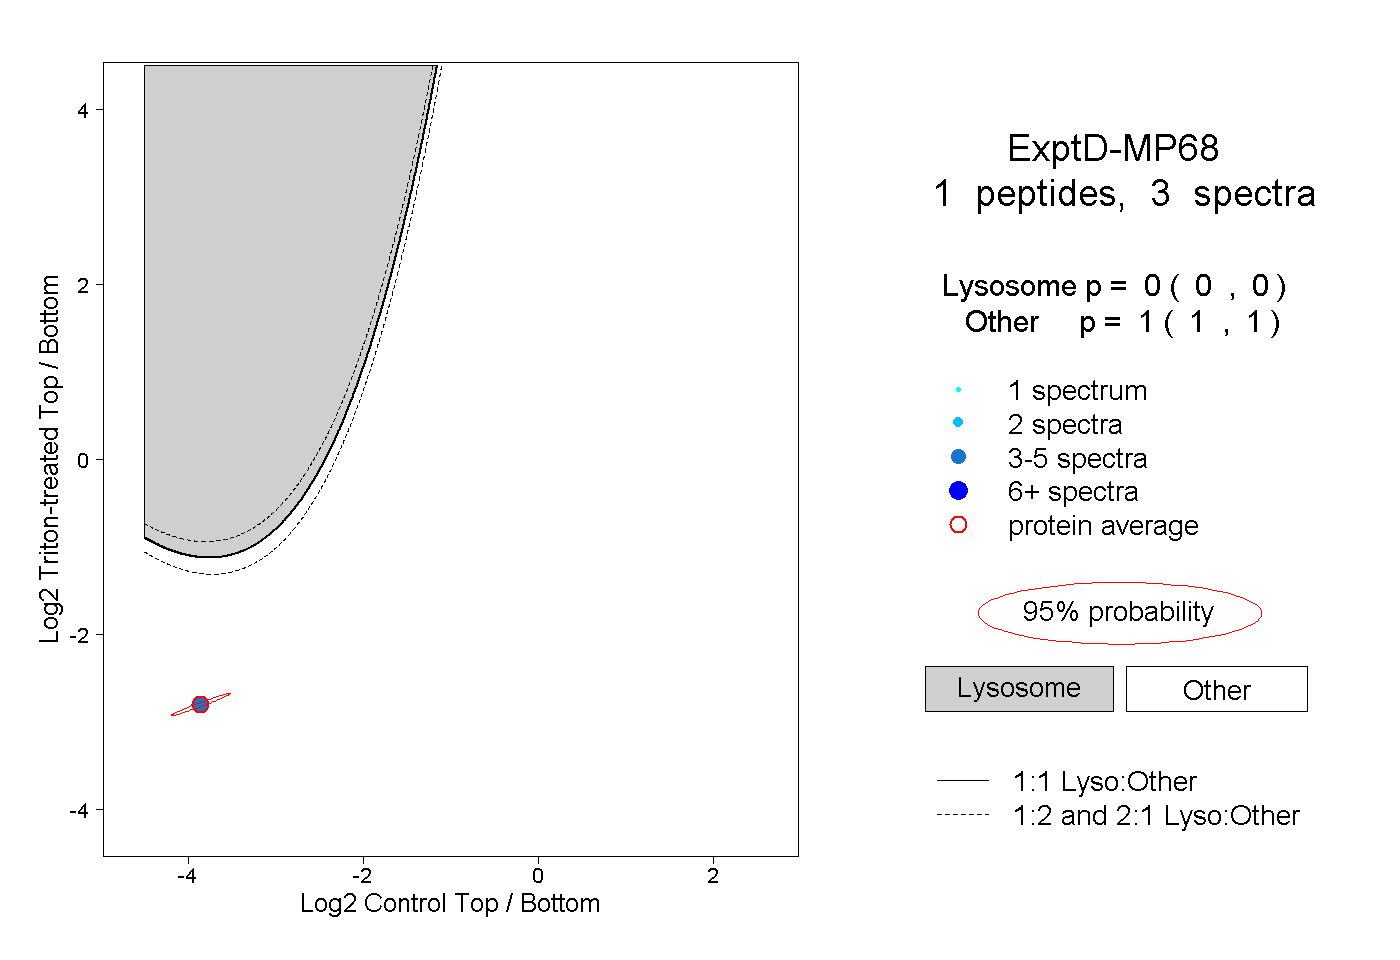
0.000 | 0.000
1.000 | 1.000