29
29peptides
spectra
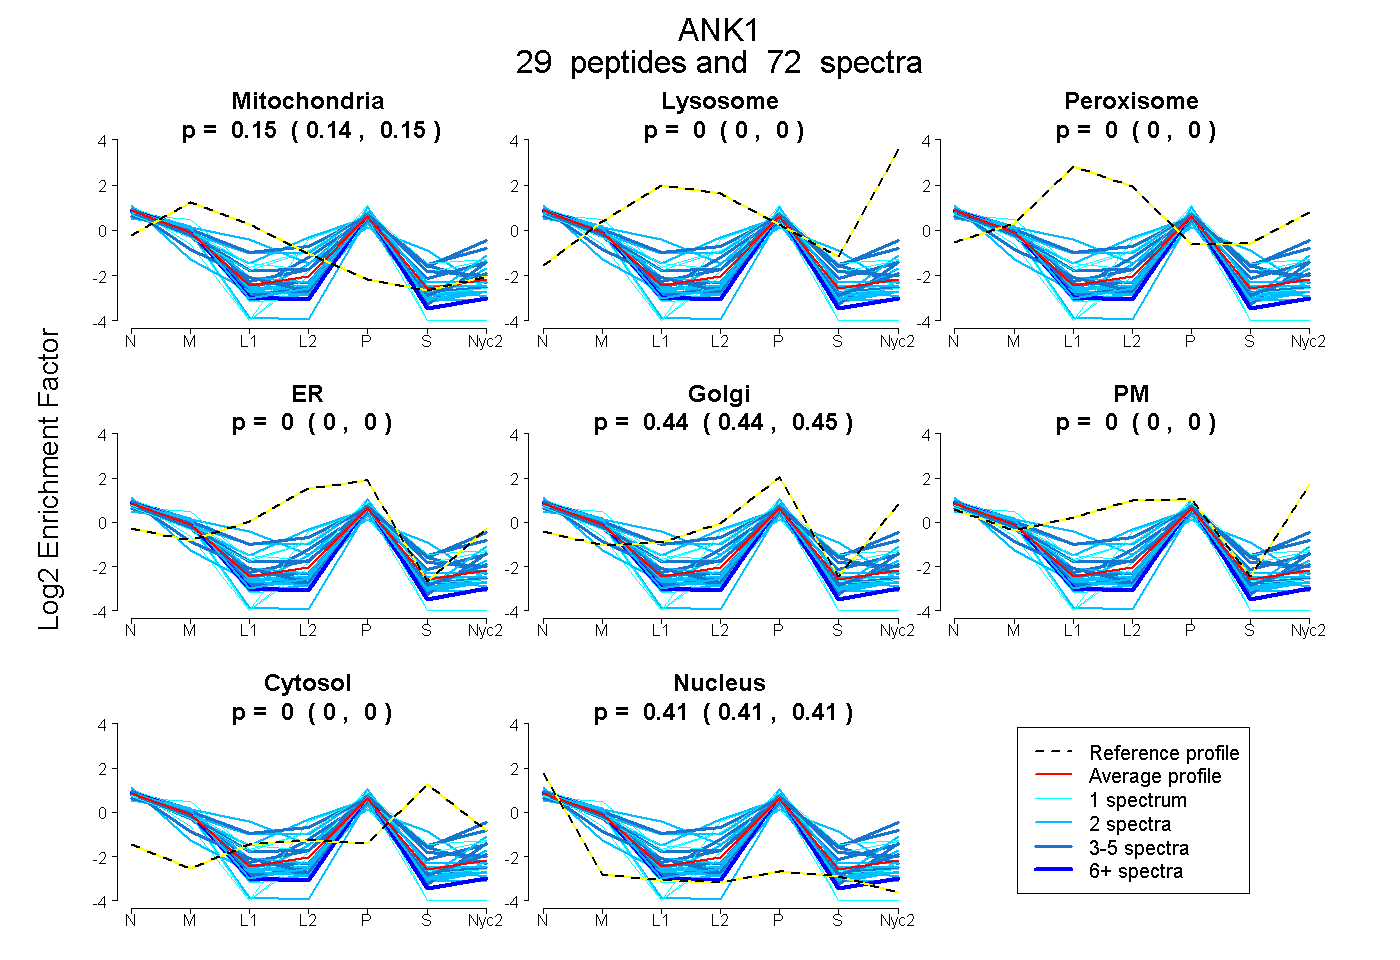
0.142 | 0.151
0.000 | 0.000
0.000 | 0.000
0.000 | 0.000
0.439 | 0.446
0.000 | 0.000
0.000 | 0.000
0.406 | 0.414
11peptides
spectra
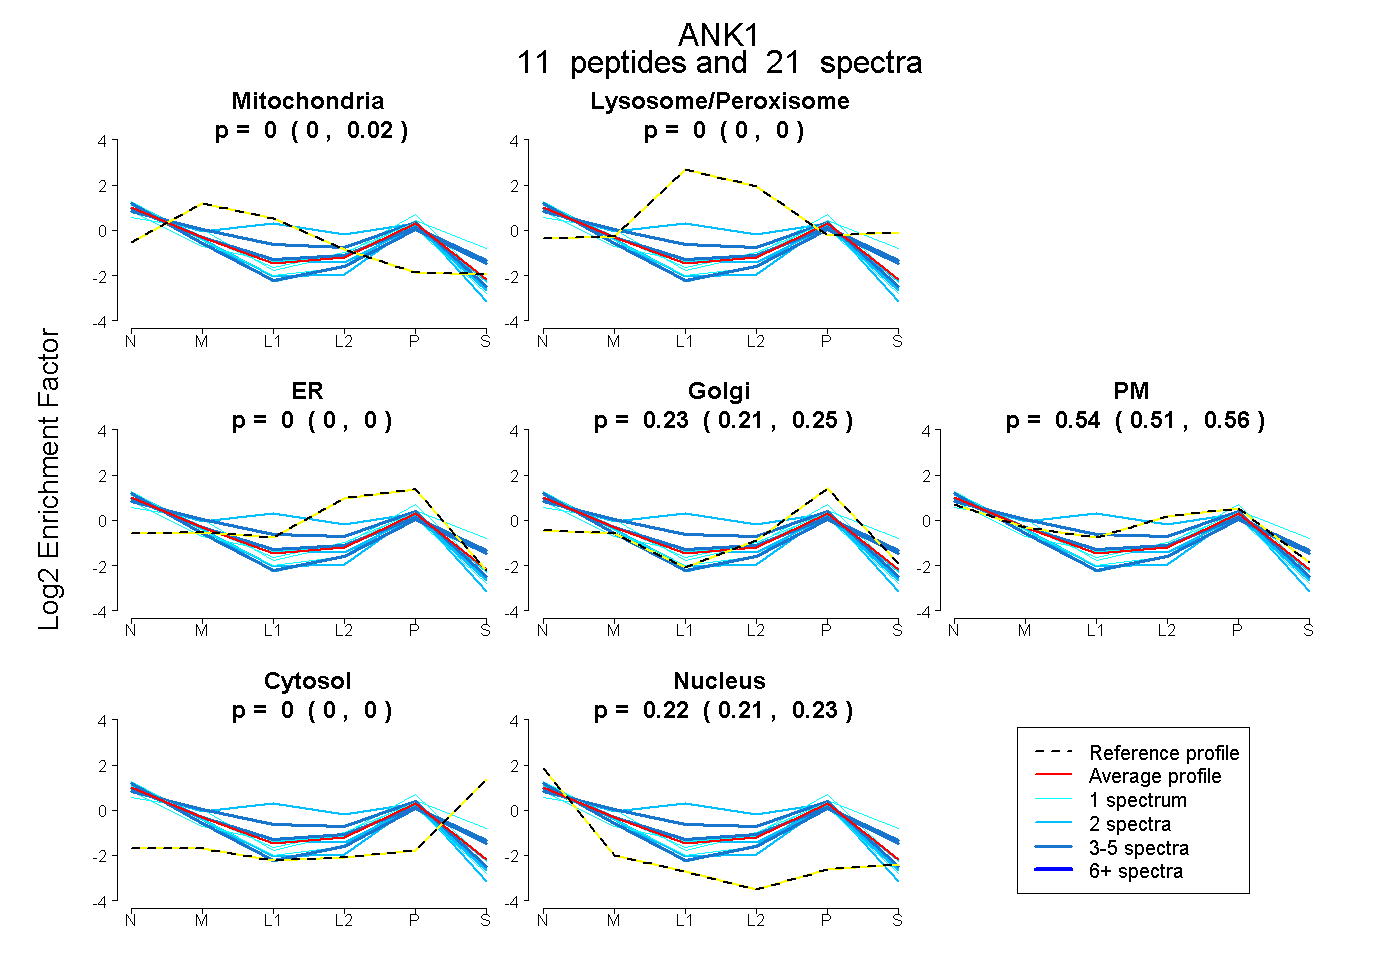
0.000 | 0.016
0.000 | 0.000
0.000 | 0.000
0.209 | 0.254
0.509 | 0.564
0.000 | 0.000
0.213 | 0.230
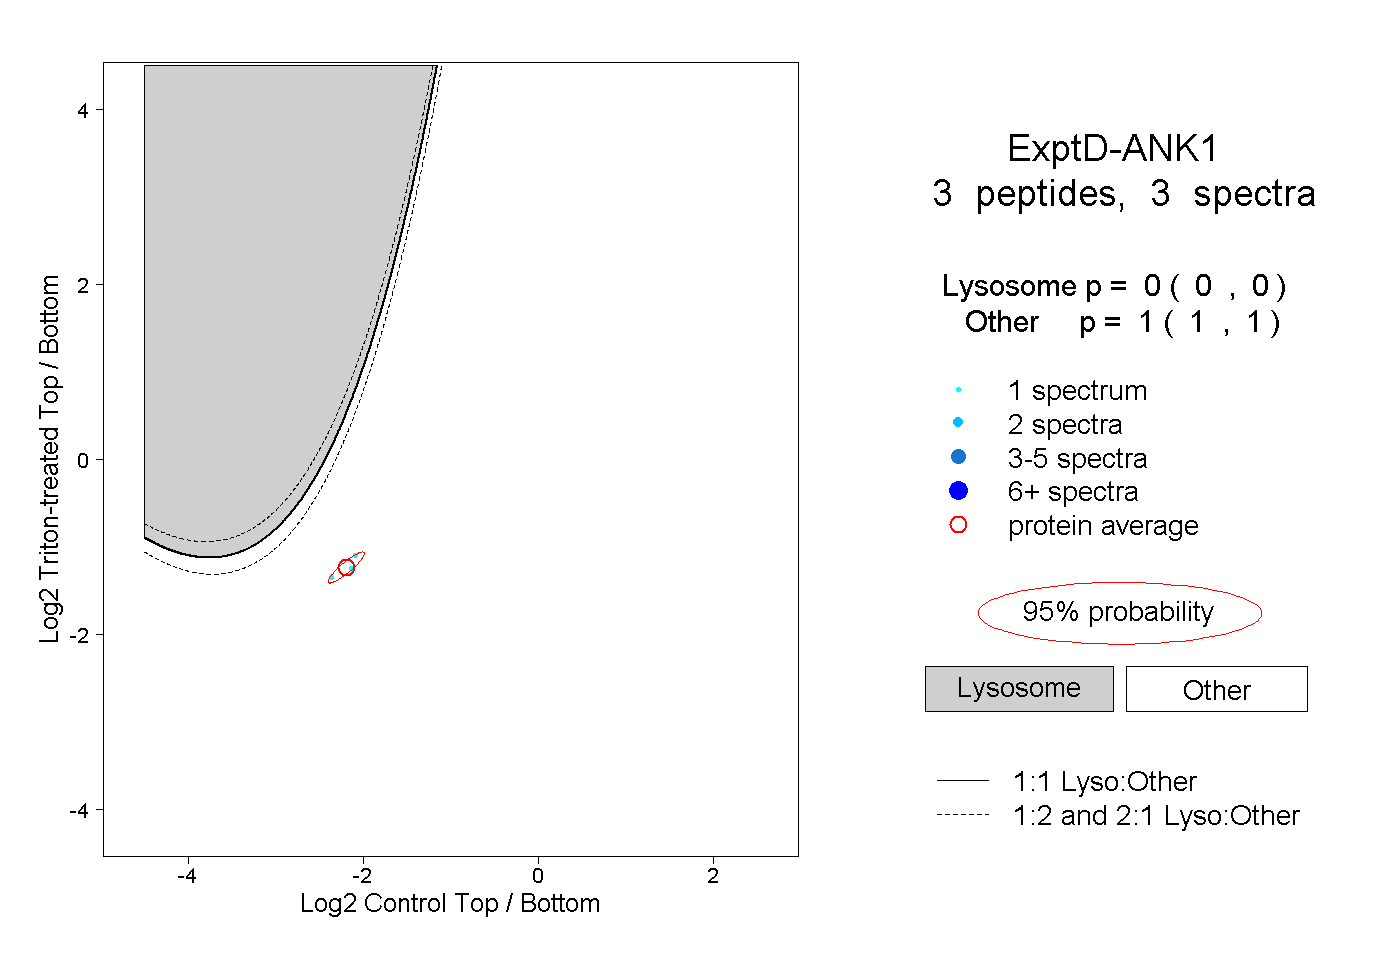
6peptides
spectra
0.000 | 0.004
0.996 | 1.000