 29
29peptides
spectra
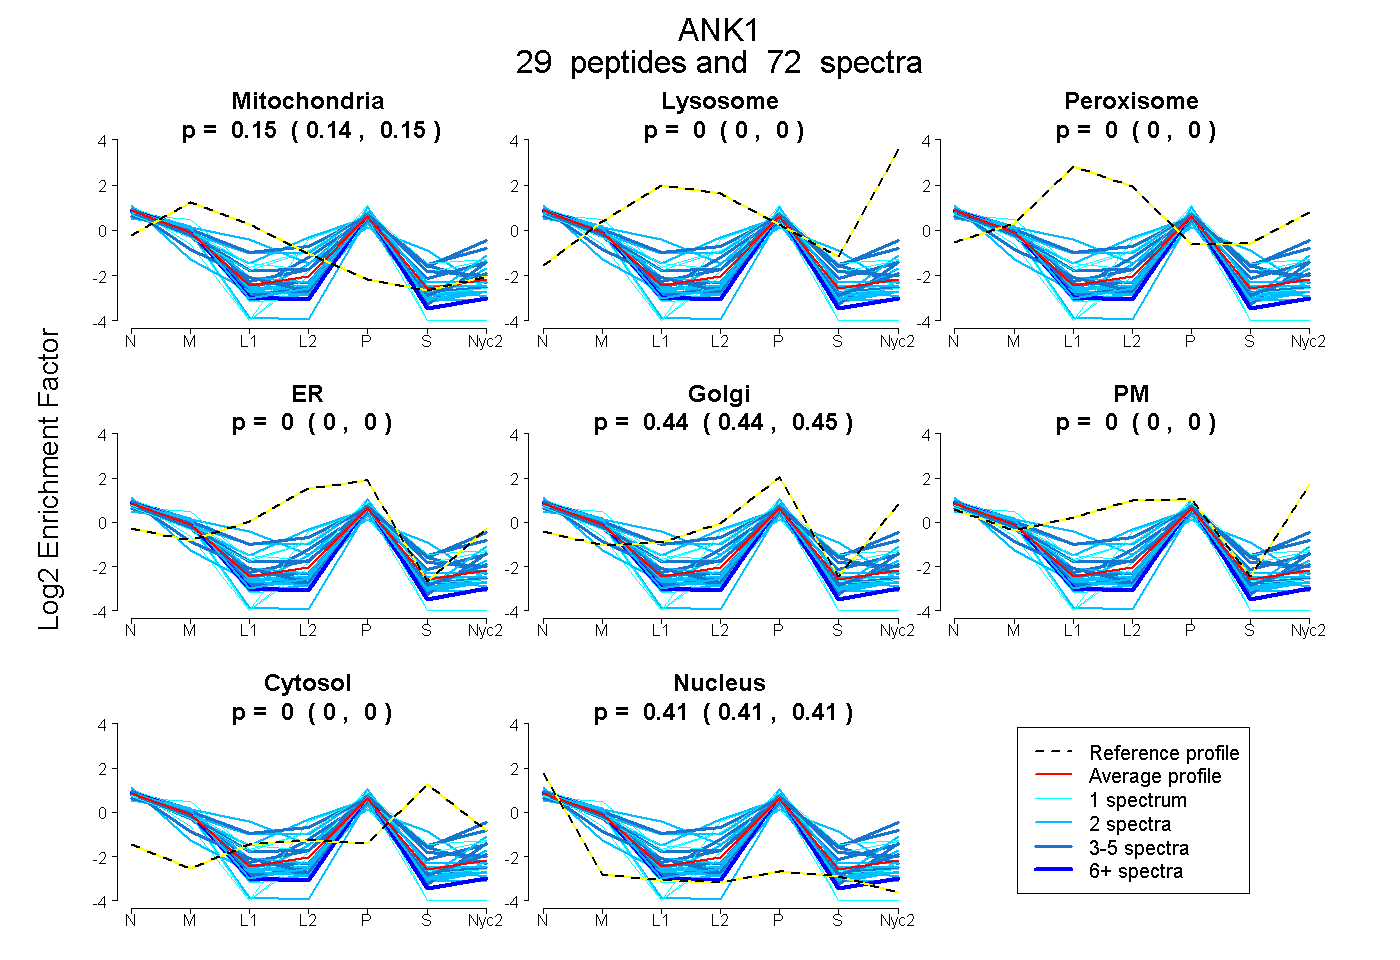
0.142 | 0.151
0.000 | 0.000
0.000 | 0.000
0.000 | 0.000
0.439 | 0.446
0.000 | 0.000
0.000 | 0.000
0.406 | 0.414
| Plot | Mito | Lyso | Perox | ER | Golgi | PM | Cytosol | Nucleus | |||||
| Expt A |
29 peptides |
72 spectra |
|
0.146 0.142 | 0.151 |
0.000 0.000 | 0.000 |
0.000 0.000 | 0.000 |
0.000 0.000 | 0.000 |
0.443 0.439 | 0.446 |
0.000 0.000 | 0.000 |
0.000 0.000 | 0.000 |
0.411 0.406 | 0.414 |
| 1 spectrum, LLLENDASPNLATTAGHTPLHTAAR | 0.000 | 0.000 | 0.000 | 0.418 | 0.000 | 0.000 | 0.000 | 0.582 | ||
| 2 spectra, IPCVTPETVVIR | 0.229 | 0.000 | 0.000 | 0.112 | 0.446 | 0.013 | 0.000 | 0.200 | ||
| 1 spectrum, ALNGFTPLHIACK | 0.353 | 0.000 | 0.000 | 0.283 | 0.092 | 0.000 | 0.000 | 0.272 | ||
| 2 spectra, DSGEGDTTSLR | 0.004 | 0.000 | 0.000 | 0.000 | 0.299 | 0.000 | 0.000 | 0.697 | ||
| 2 spectra, ALDHLR | 0.143 | 0.000 | 0.000 | 0.043 | 0.406 | 0.000 | 0.000 | 0.407 | ||
| 2 spectra, AGHTEVAK | 0.159 | 0.000 | 0.000 | 0.499 | 0.000 | 0.000 | 0.000 | 0.342 | ||
| 3 spectra, TLTPLTLR | 0.031 | 0.000 | 0.000 | 0.000 | 0.494 | 0.000 | 0.002 | 0.474 | ||
| 3 spectra, TLEQHENFVEVAR | 0.203 | 0.000 | 0.000 | 0.000 | 0.462 | 0.000 | 0.000 | 0.334 | ||
| 5 spectra, MVVELLHK | 0.137 | 0.000 | 0.000 | 0.000 | 0.392 | 0.000 | 0.000 | 0.470 | ||
| 3 spectra, EGHVDTALALLEK | 0.111 | 0.000 | 0.000 | 0.089 | 0.374 | 0.000 | 0.039 | 0.387 | ||
| 3 spectra, VETPLHMAAR | 0.278 | 0.000 | 0.000 | 0.006 | 0.466 | 0.081 | 0.074 | 0.096 | ||
| 5 spectra, LPALHIAAR | 0.044 | 0.000 | 0.000 | 0.000 | 0.581 | 0.000 | 0.056 | 0.319 | ||
| 2 spectra, TAEAVHFATLLYK | 0.159 | 0.000 | 0.000 | 0.000 | 0.318 | 0.000 | 0.000 | 0.523 | ||
| 2 spectra, AEDSDAIPEWK | 0.413 | 0.000 | 0.000 | 0.236 | 0.003 | 0.000 | 0.201 | 0.147 | ||
| 2 spectra, FWLSDCPR | 0.151 | 0.000 | 0.000 | 0.000 | 0.458 | 0.000 | 0.000 | 0.391 | ||
| 2 spectra, QNQIEVAR | 0.198 | 0.000 | 0.000 | 0.000 | 0.429 | 0.000 | 0.000 | 0.373 | ||
| 2 spectra, LDQVVESPAIPR | 0.164 | 0.000 | 0.000 | 0.000 | 0.351 | 0.000 | 0.000 | 0.485 | ||
| 5 spectra, FHRPIGLR | 0.198 | 0.000 | 0.000 | 0.000 | 0.470 | 0.000 | 0.000 | 0.331 | ||
| 2 spectra, LAIPVK | 0.095 | 0.000 | 0.000 | 0.000 | 0.438 | 0.000 | 0.000 | 0.468 | ||
| 1 spectrum, YLLQNK | 0.141 | 0.000 | 0.000 | 0.046 | 0.522 | 0.000 | 0.068 | 0.222 | ||
| 1 spectrum, EPGGFLSFLR | 0.037 | 0.000 | 0.000 | 0.000 | 0.431 | 0.000 | 0.000 | 0.532 | ||
| 2 spectra, VMELLLK | 0.129 | 0.000 | 0.000 | 0.000 | 0.377 | 0.000 | 0.000 | 0.494 | ||
| 4 spectra, FVIFAK | 0.083 | 0.000 | 0.000 | 0.000 | 0.490 | 0.000 | 0.000 | 0.427 | ||
| 1 spectrum, SGNLDK | 0.239 | 0.000 | 0.000 | 0.000 | 0.508 | 0.000 | 0.000 | 0.253 | ||
| 1 spectrum, SEDQEQASK | 0.000 | 0.000 | 0.000 | 0.000 | 0.444 | 0.000 | 0.000 | 0.556 | ||
| 1 spectrum, LAELLLEHDAHPNAAGK | 0.000 | 0.000 | 0.000 | 0.270 | 0.080 | 0.000 | 0.000 | 0.650 | ||
| 8 spectra, TCAAPTR | 0.104 | 0.000 | 0.000 | 0.000 | 0.346 | 0.000 | 0.000 | 0.550 | ||
| 2 spectra, SEIVNMLEGSGR | 0.000 | 0.000 | 0.000 | 0.000 | 0.446 | 0.000 | 0.000 | 0.554 | ||
| 2 spectra, ELVVLR | 0.134 | 0.000 | 0.000 | 0.000 | 0.383 | 0.000 | 0.000 | 0.483 |
| Plot | Mito | Lyso or Perox | ER | Golgi | PM | Cytosol | Nucleus | ||||||
| Expt B |
11 peptides |
21 spectra |
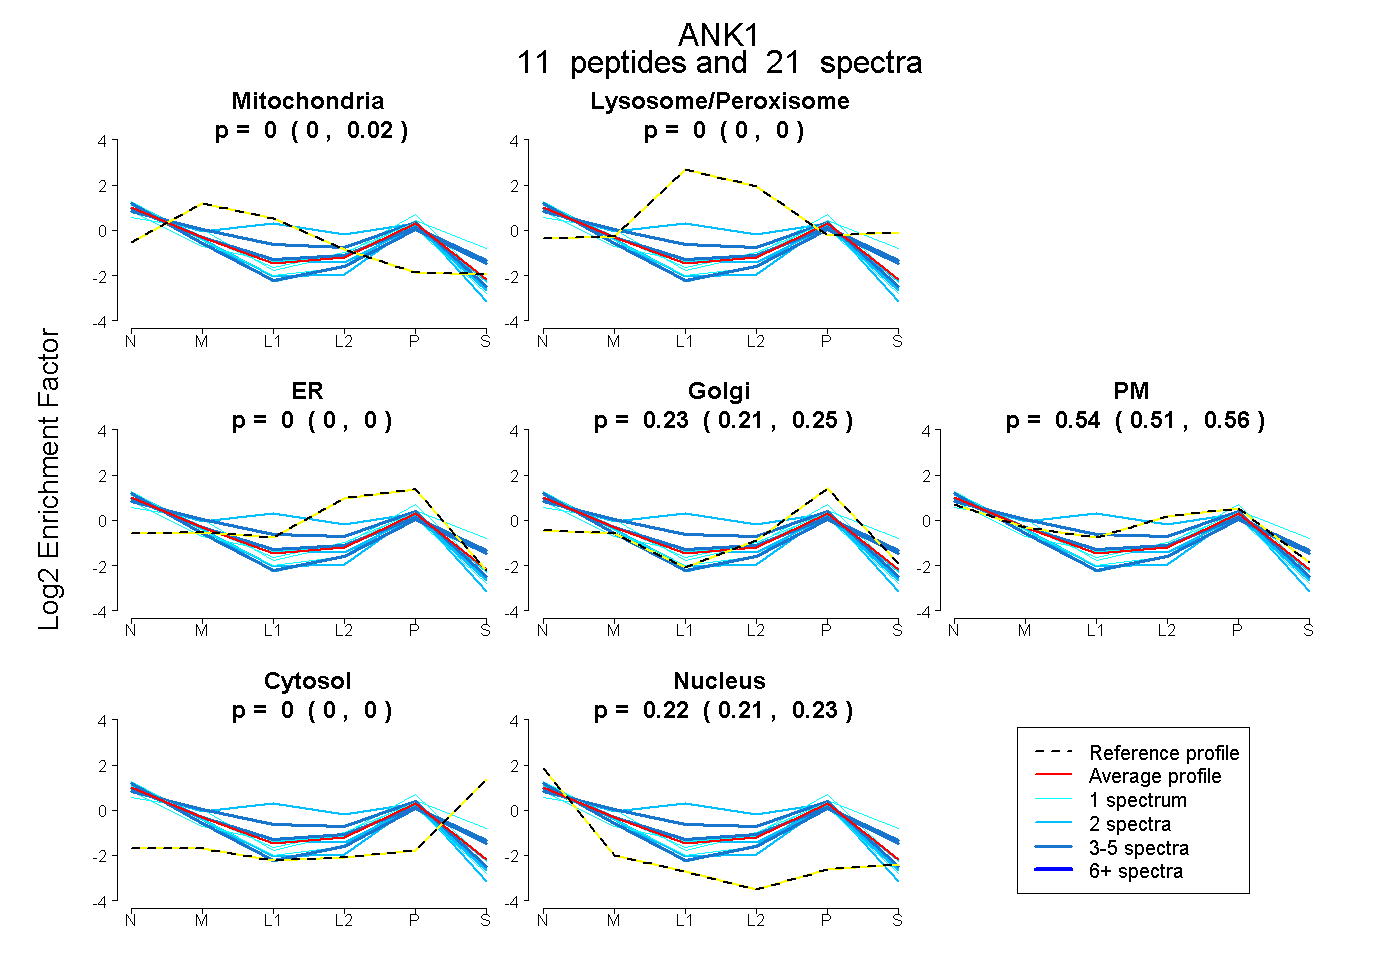 |
0.004 0.000 | 0.016 |
0.000 0.000 | 0.000 |
0.000 0.000 | 0.000 |
0.232 0.209 | 0.254 |
0.542 0.509 | 0.564 |
0.000 0.000 | 0.000 |
0.222 0.213 | 0.230 |
|||
| Plot | Lyso | Other | |||||||||||
| Expt C |
6 peptides |
7 spectra |
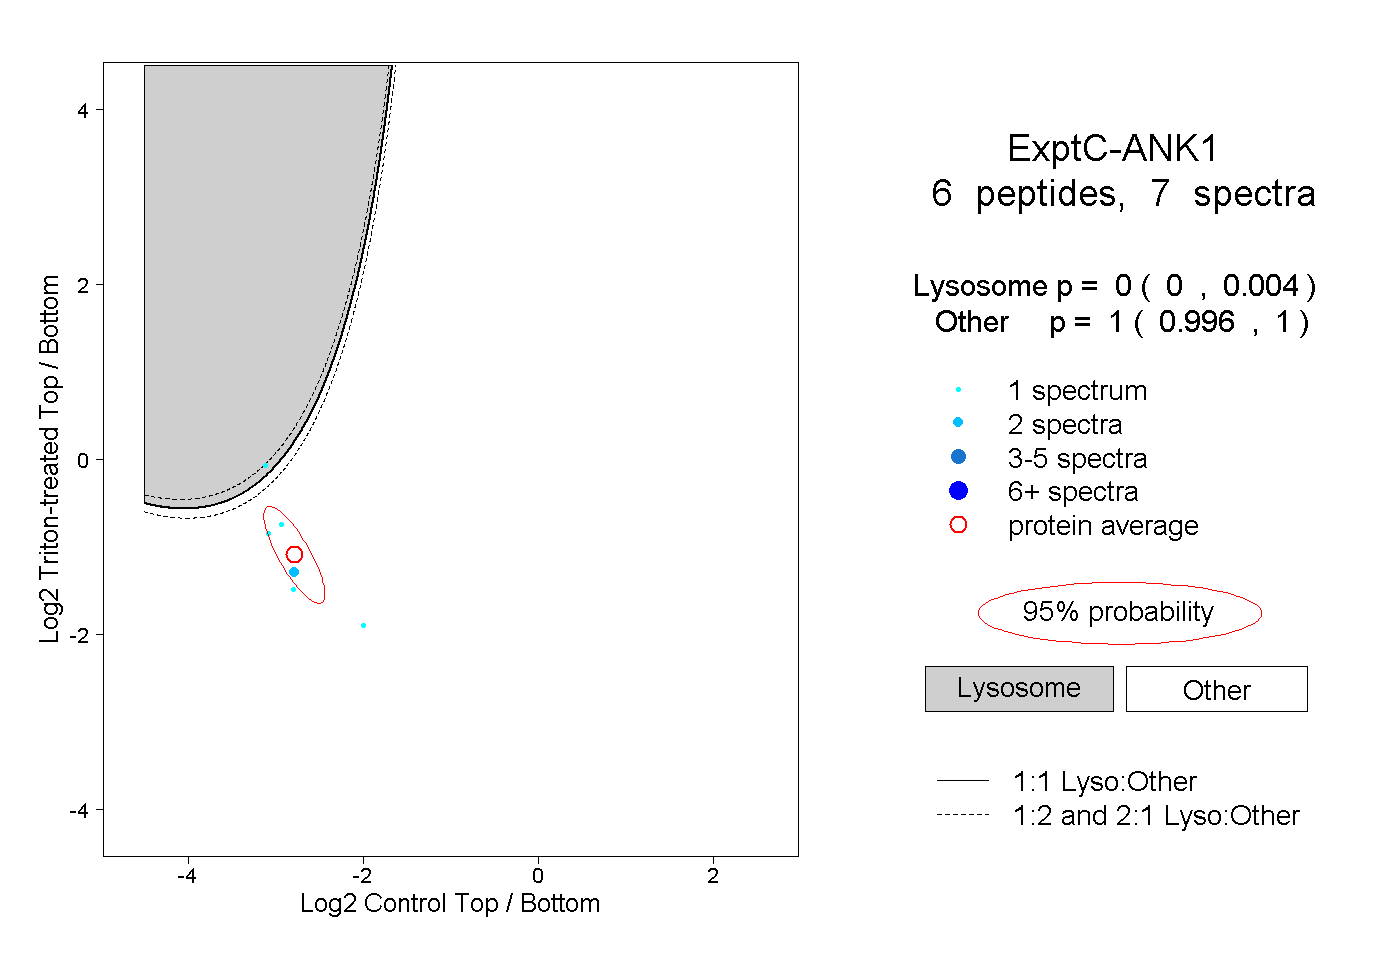 |
0.000 0.000 | 0.004 |
1.000 0.996 | 1.000 |
||||||||
| Plot | Lyso | Other | |||||||||||
| Expt D |
3 peptides |
3 spectra |
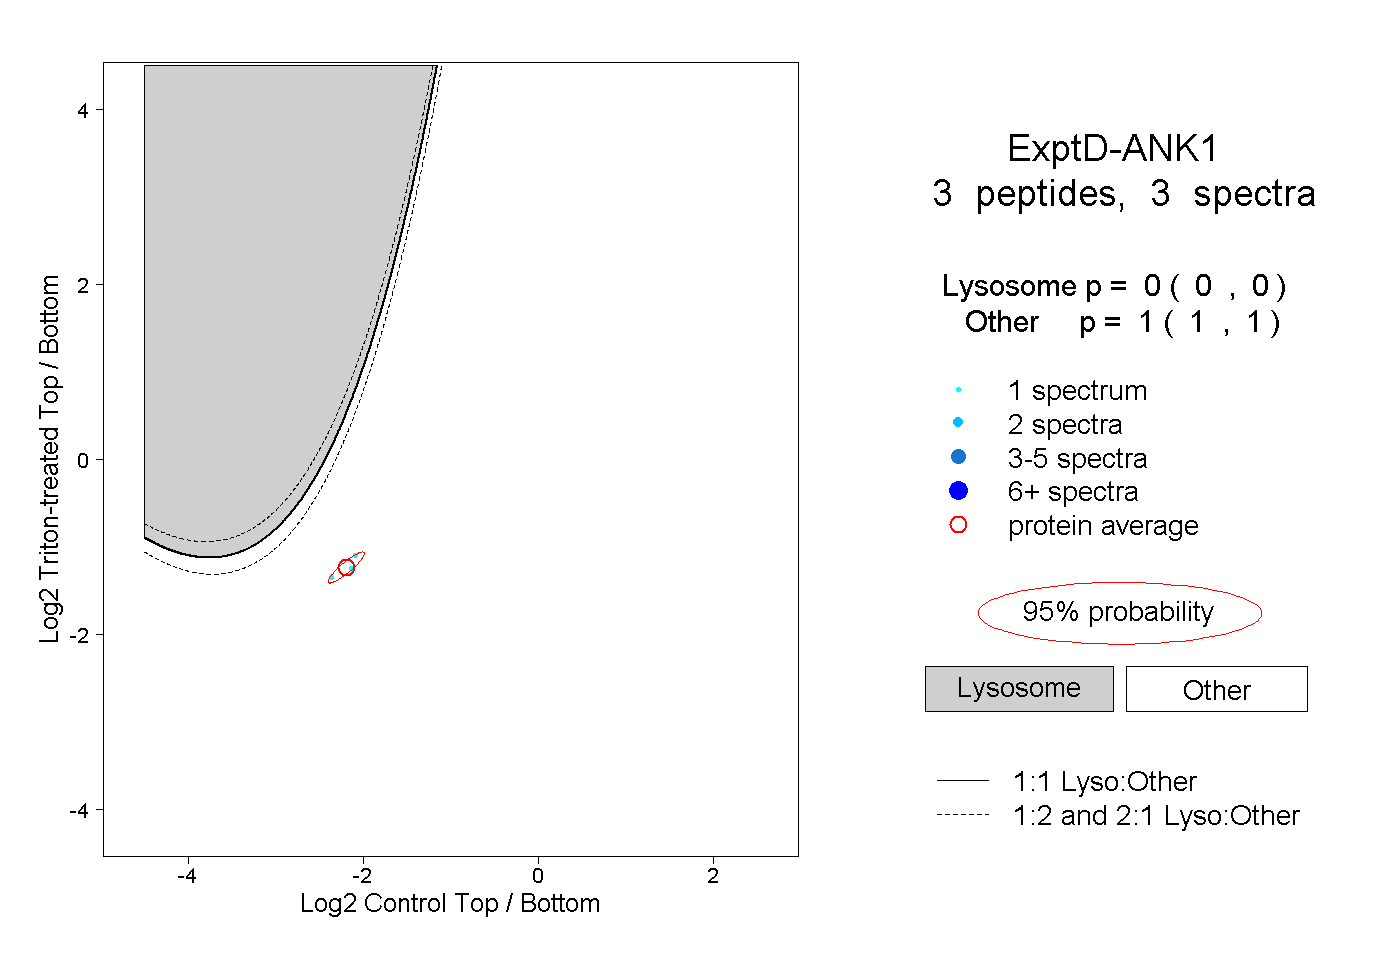 |
0.000 0.000 | 0.000 |
1.000 1.000 | 1.000 |