13
13peptides
spectra
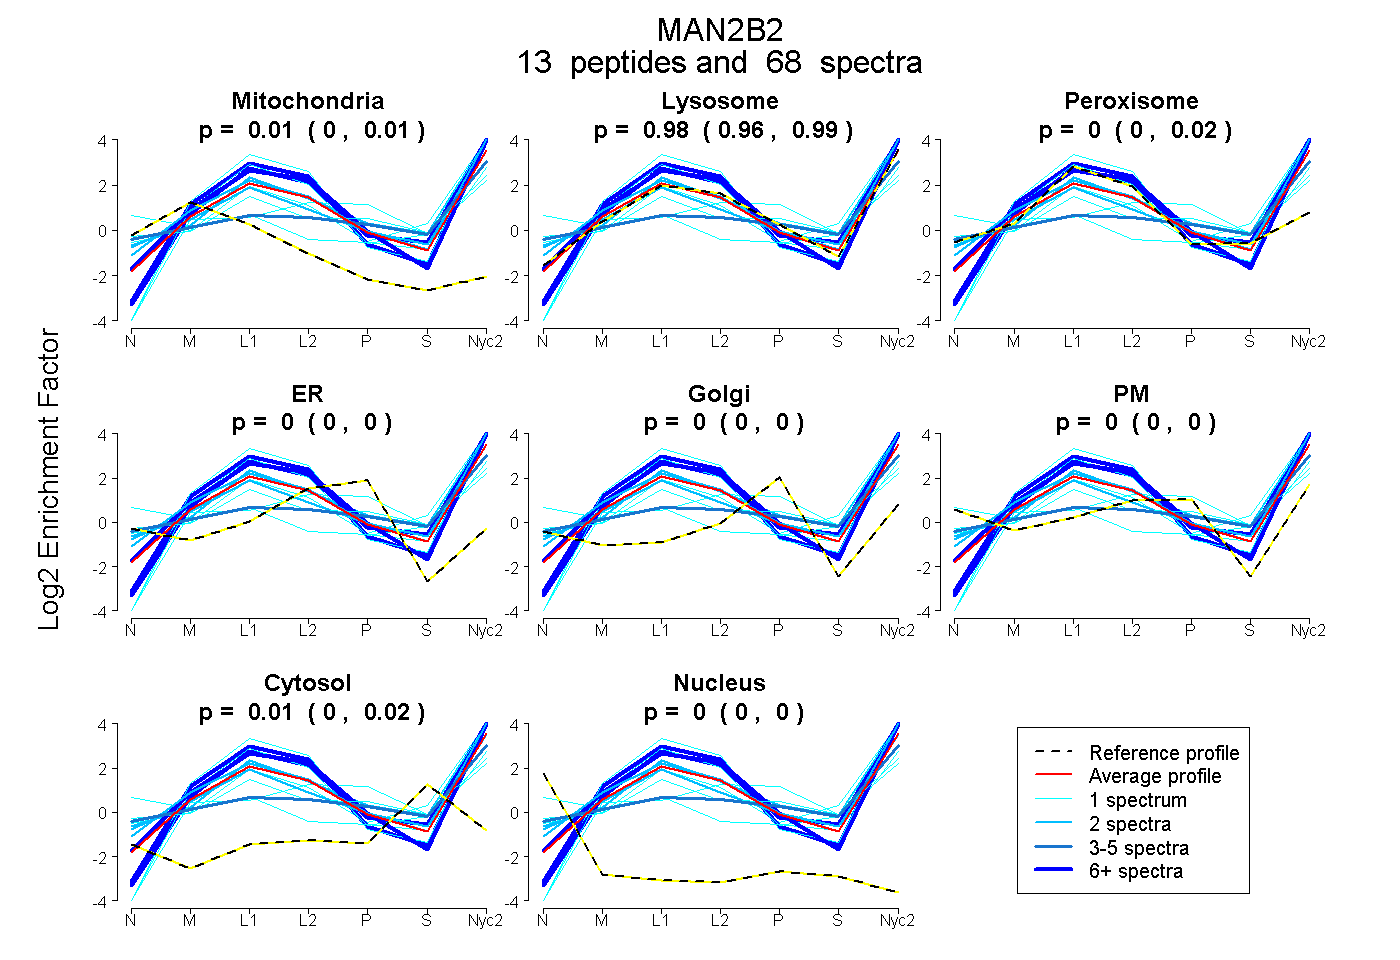
0.000 | 0.013
0.963 | 0.986
0.000 | 0.021
0.000 | 0.000
0.000 | 0.000
0.000 | 0.000
0.002 | 0.019
0.000 | 0.000
6peptides
spectra
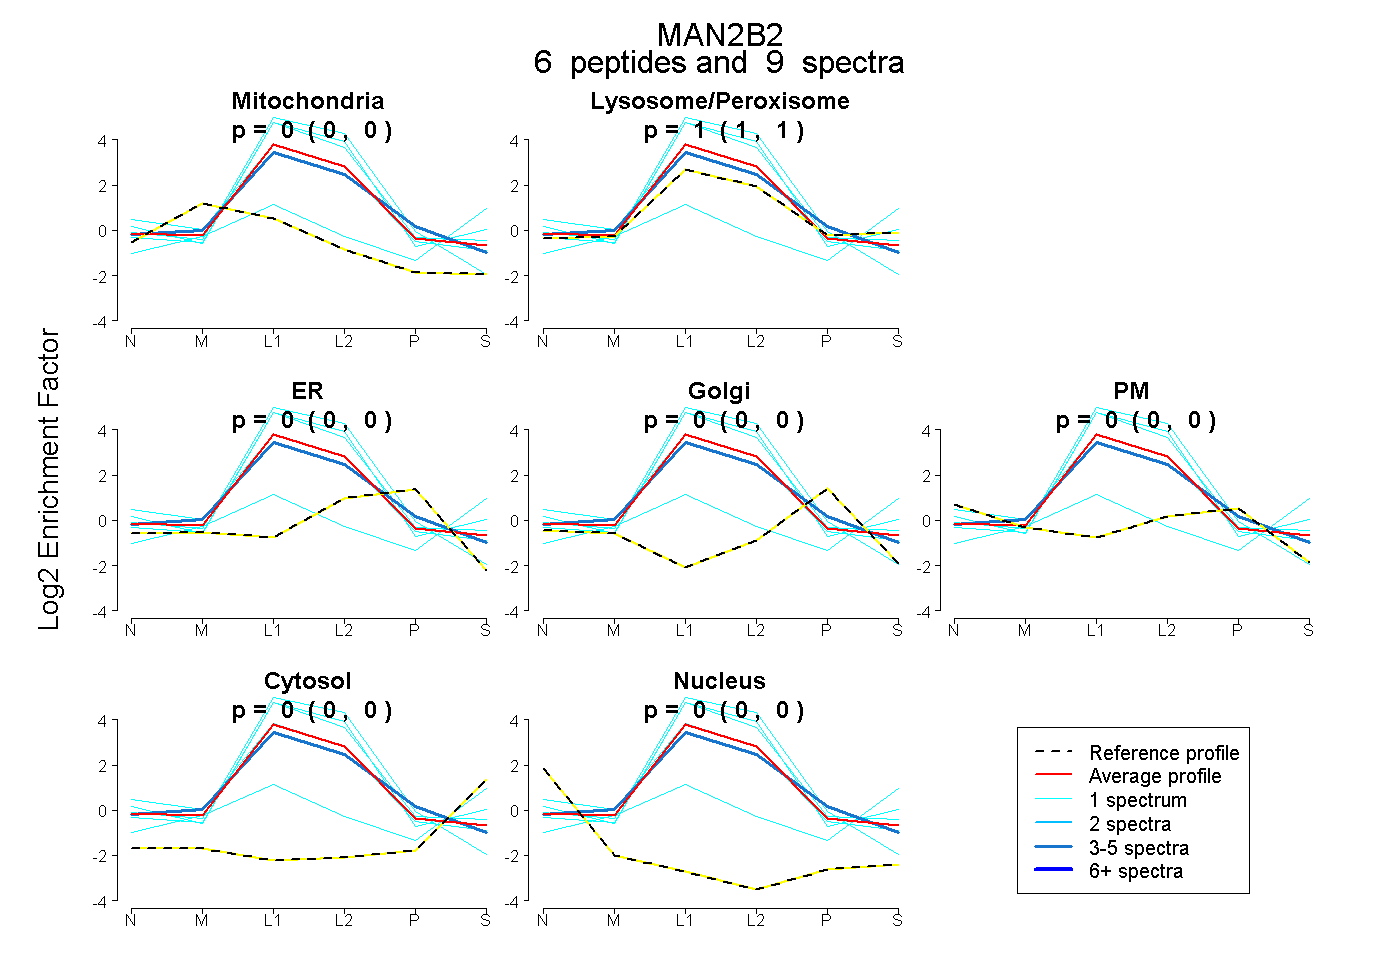
0.000 | 0.000
1.000 | 1.000
0.000 | 0.000
0.000 | 0.000
0.000 | 0.000
0.000 | 0.000
0.000 | 0.000