 2
2peptides
spectra
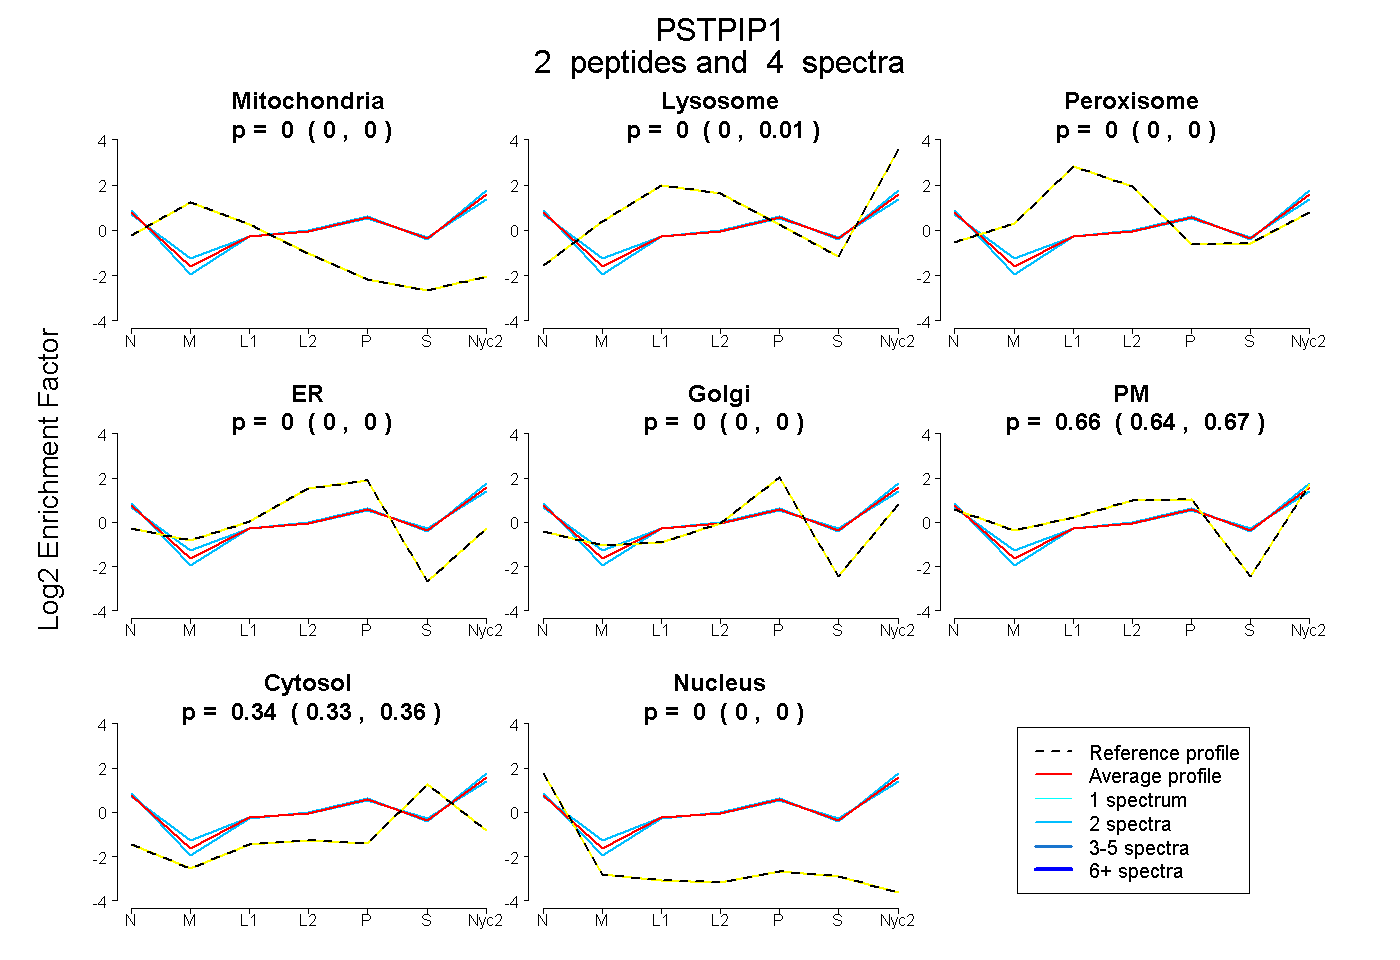
0.000 | 0.000
0.000 | 0.014
0.000 | 0.000
0.000 | 0.000
0.000 | 0.000
0.640 | 0.667
0.327 | 0.356
0.000 | 0.000
1peptide
spectra
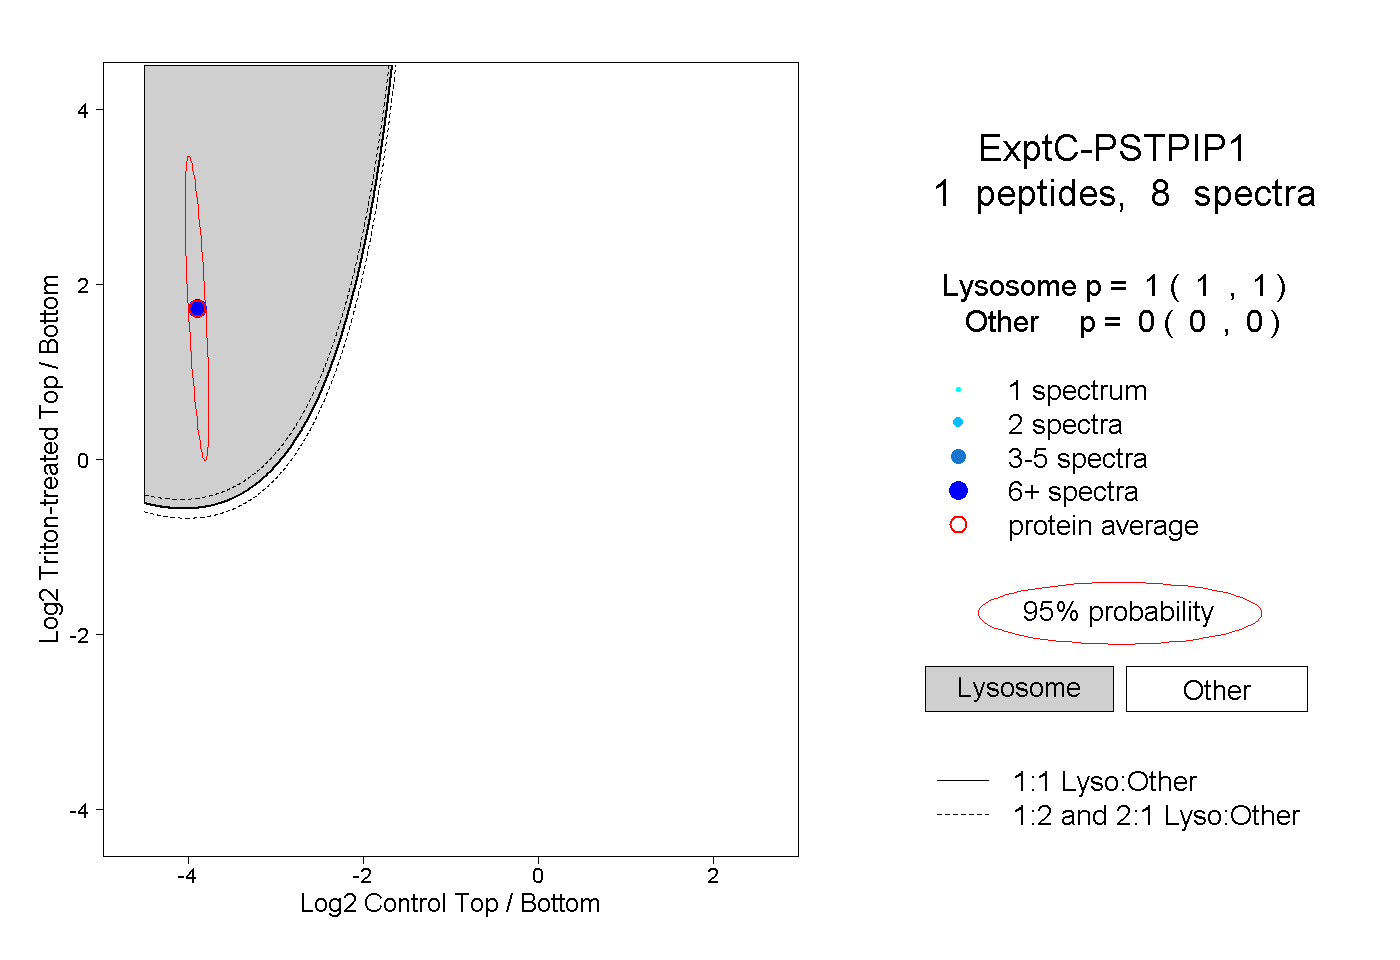
1.000 | 1.000
0.000 | 0.000
| Plot | Mito | Lyso | Perox | ER | Golgi | PM | Cytosol | Nucleus | |||||
| Expt A |
2 peptides |
4 spectra |
|
0.000 0.000 | 0.000 |
0.000 0.000 | 0.014 |
0.000 0.000 | 0.000 |
0.000 0.000 | 0.000 |
0.000 0.000 | 0.000 |
0.658 0.640 | 0.667 |
0.342 0.327 | 0.356 |
0.000 0.000 | 0.000 |
||
| Plot | Lyso | Other | |||||||||||
| Expt C |
1 peptide |
8 spectra |
|
1.000 1.000 | 1.000 |
0.000 0.000 | 0.000 |
| 8 spectra, LSLYK | 1.000 | 0.000 |