 11
11peptides
spectra
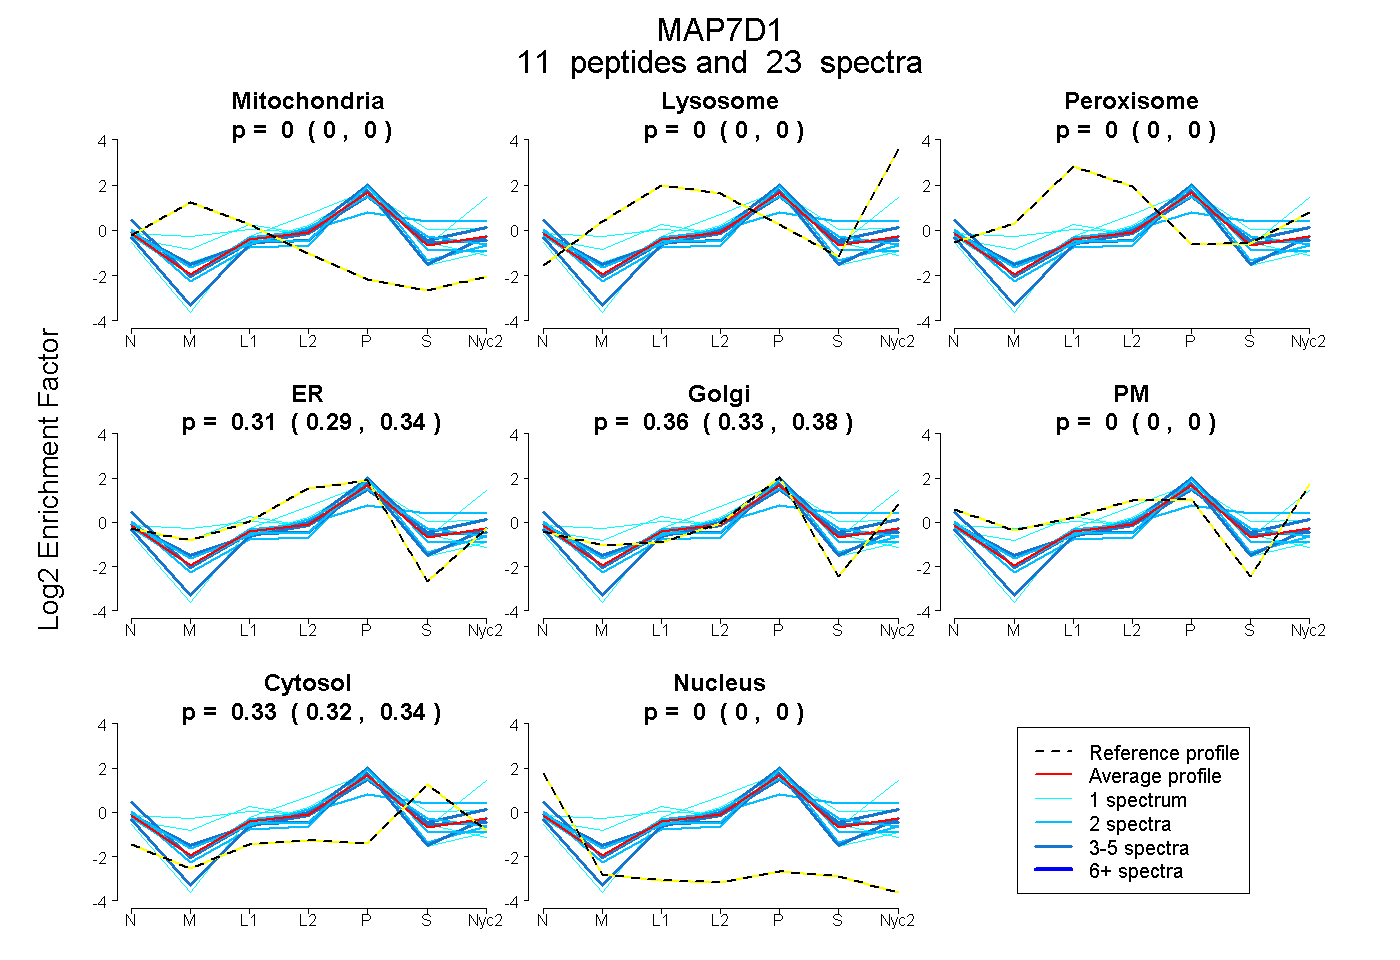
0.000 | 0.000
0.000 | 0.000
0.000 | 0.000
0.289 | 0.335
0.327 | 0.381
0.000 | 0.000
0.318 | 0.340
0.000 | 0.000
| Plot | Mito | Lyso | Perox | ER | Golgi | PM | Cytosol | Nucleus | |||||
| Expt A |
11 peptides |
23 spectra |
|
0.000 0.000 | 0.000 |
0.000 0.000 | 0.000 |
0.000 0.000 | 0.000 |
0.315 0.289 | 0.335 |
0.356 0.327 | 0.381 |
0.000 0.000 | 0.000 |
0.329 0.318 | 0.340 |
0.000 0.000 | 0.000 |
| 1 spectrum, GTTASPK | 0.175 | 0.000 | 0.000 | 0.469 | 0.248 | 0.000 | 0.108 | 0.000 | ||
| 1 spectrum, CTPSGERPER | 0.000 | 0.000 | 0.000 | 0.618 | 0.021 | 0.000 | 0.361 | 0.000 | ||
| 1 spectrum, DQAVPVCPR | 0.000 | 0.255 | 0.039 | 0.000 | 0.557 | 0.000 | 0.148 | 0.000 | ||
| 2 spectra, SLQLSAWESSIVDR | 0.000 | 0.000 | 0.000 | 0.333 | 0.327 | 0.000 | 0.305 | 0.034 | ||
| 4 spectra, SAVTLPR | 0.000 | 0.000 | 0.056 | 0.111 | 0.523 | 0.002 | 0.308 | 0.000 | ||
| 2 spectra, YEAAIQR | 0.000 | 0.000 | 0.000 | 0.457 | 0.151 | 0.000 | 0.392 | 0.000 | ||
| 4 spectra, LMTPTLSFLAR | 0.000 | 0.000 | 0.000 | 0.284 | 0.329 | 0.000 | 0.387 | 0.000 | ||
| 3 spectra, QSLPASIRPR | 0.000 | 0.000 | 0.000 | 0.199 | 0.562 | 0.000 | 0.144 | 0.095 | ||
| 2 spectra, GPTPTATGPR | 0.000 | 0.000 | 0.000 | 0.147 | 0.573 | 0.000 | 0.187 | 0.093 | ||
| 1 spectrum, AAEGLLPFAEADAFLK | 0.000 | 0.000 | 0.000 | 0.451 | 0.109 | 0.000 | 0.440 | 0.000 | ||
| 2 spectra, ESPSPSGPEDK | 0.000 | 0.000 | 0.060 | 0.000 | 0.138 | 0.319 | 0.483 | 0.000 |
| Plot | Mito | Lyso or Perox | ER | Golgi | PM | Cytosol | Nucleus | ||||||
| Expt B |
3 peptides |
3 spectra |
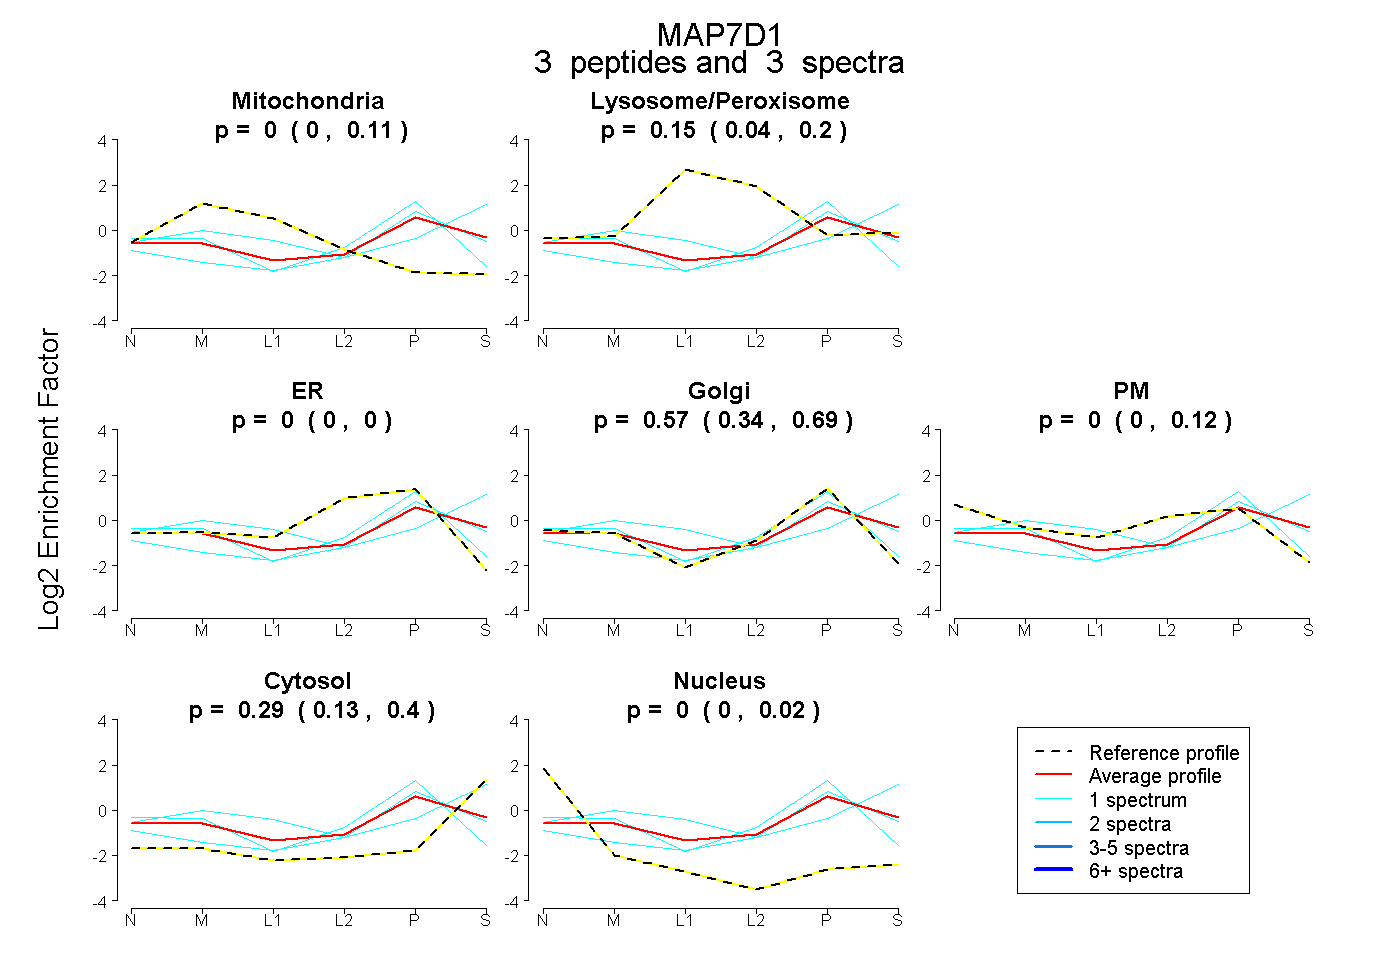 |
0.000 0.000 | 0.112 |
0.145 0.036 | 0.200 |
0.000 0.000 | 0.000 |
0.568 0.343 | 0.690 |
0.000 0.000 | 0.120 |
0.287 0.135 | 0.398 |
0.000 0.000 | 0.024 |
|||
| Plot | Lyso | Other | |||||||||||
| Expt C |
6 peptides |
11 spectra |
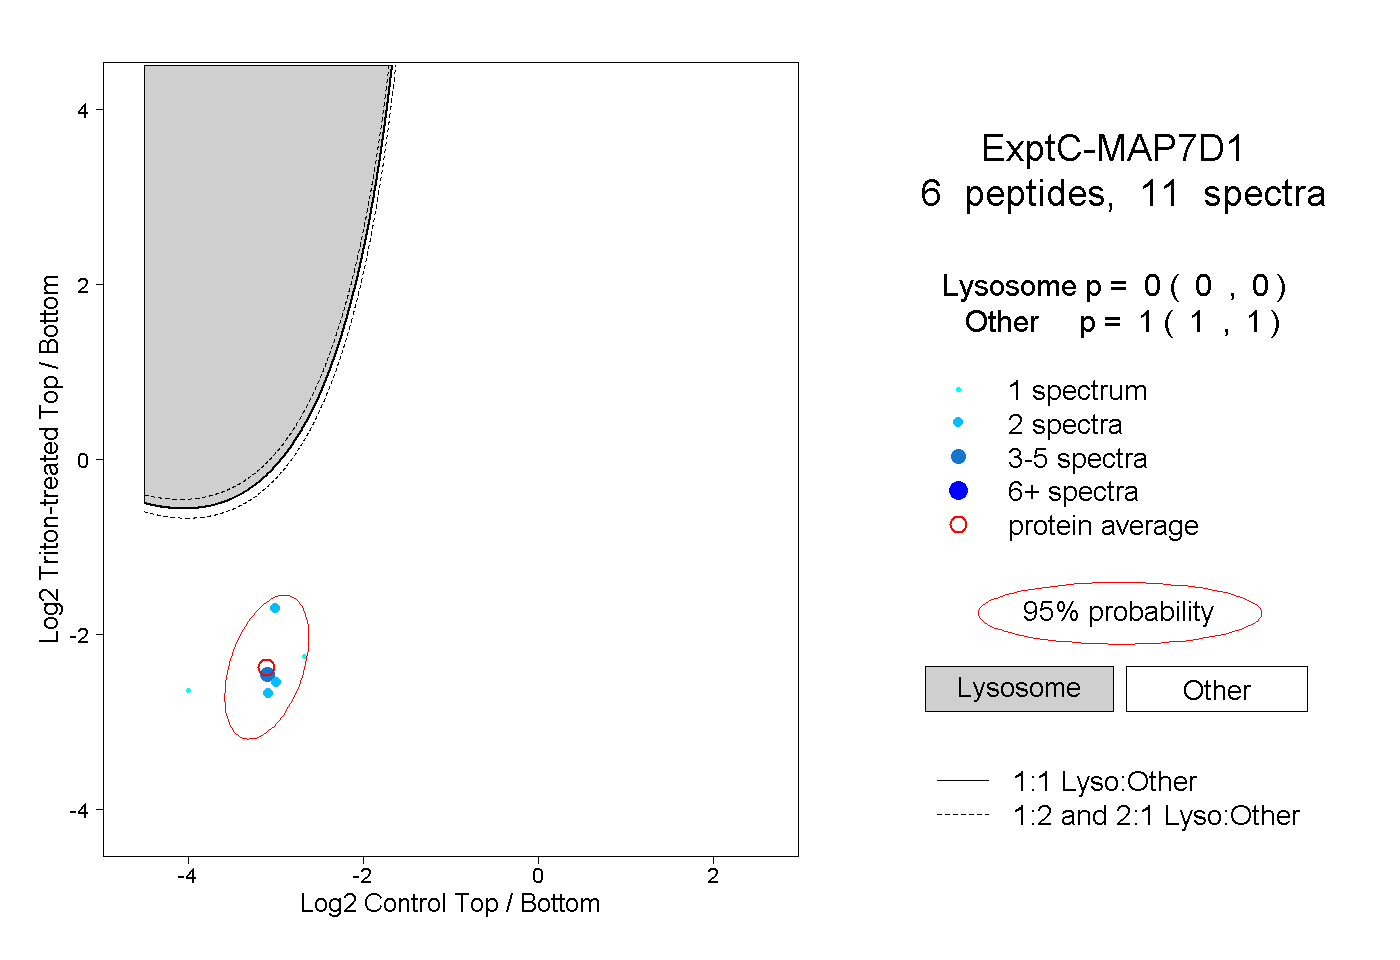 |
0.000 0.000 | 0.000 |
1.000 1.000 | 1.000 |
||||||||
| Plot | Lyso | Other | |||||||||||
| Expt D |
1 peptide |
1 spectrum |
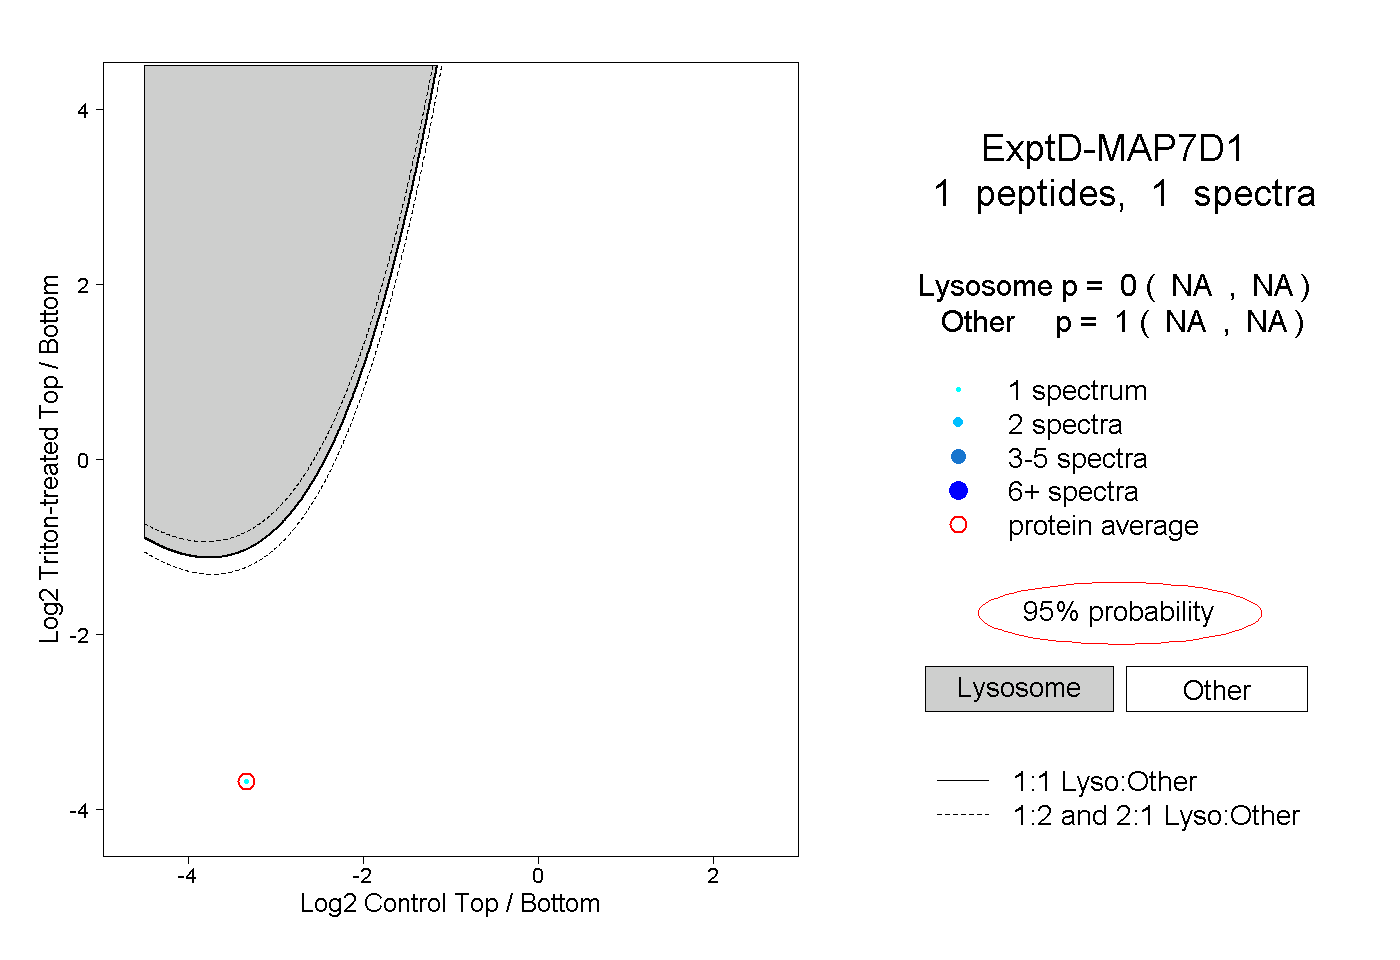 |
0.000 NA | NA |
1.000 NA | NA |