 18
18peptides
spectra
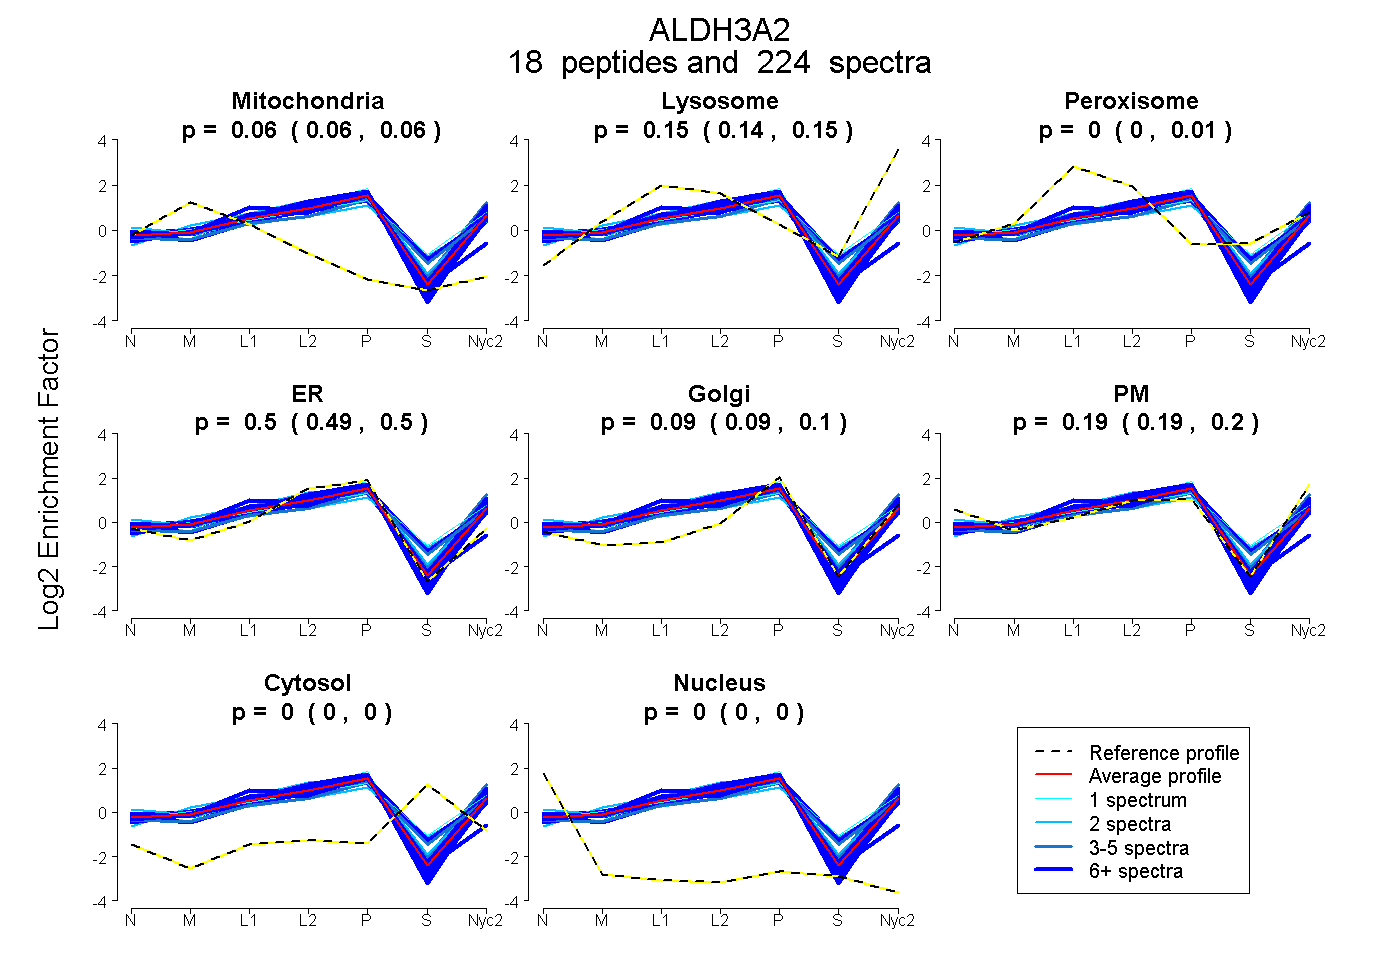
0.058 | 0.062
0.145 | 0.153
0.000 | 0.012
0.490 | 0.504
0.085 | 0.100
0.189 | 0.199
0.000 | 0.000
0.000 | 0.000
16peptides
spectra
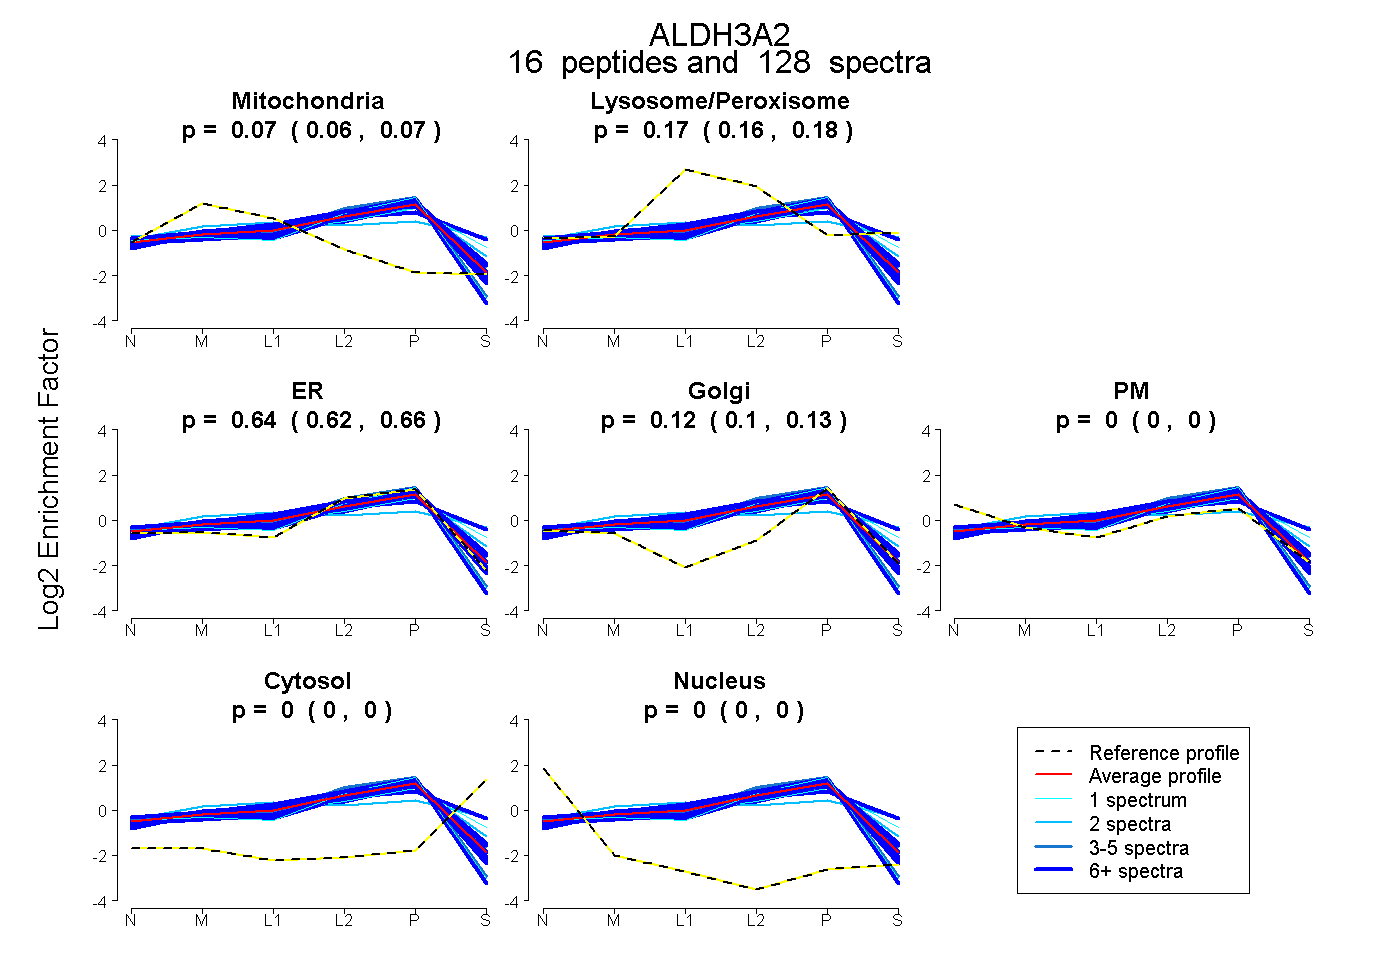
0.062 | 0.073
0.163 | 0.183
0.619 | 0.655
0.105 | 0.132
0.000 | 0.000
0.000 | 0.000
0.000 | 0.000
17peptides
spectra
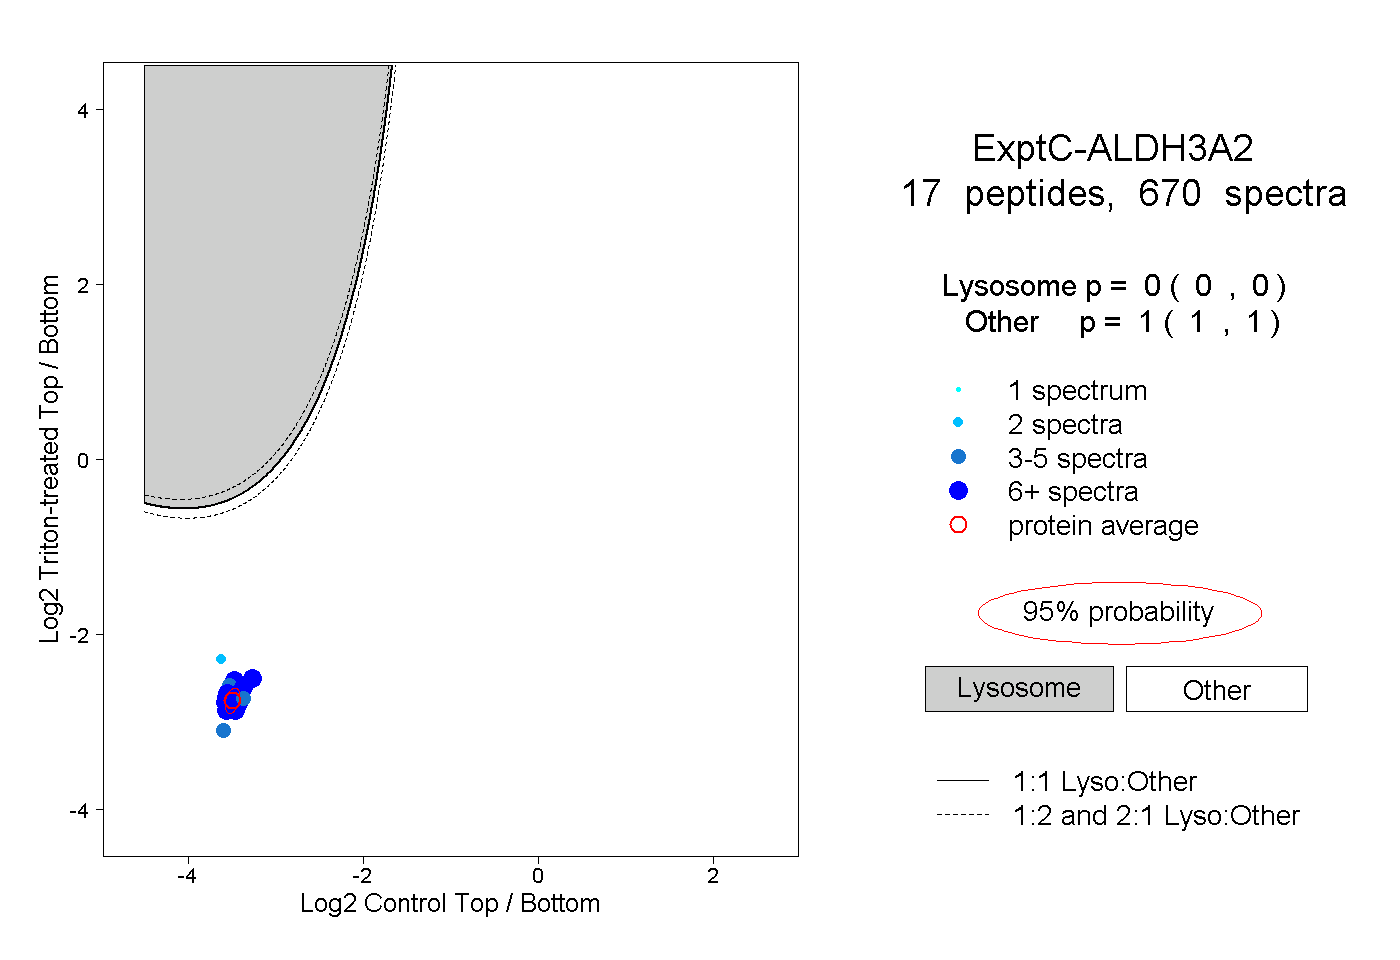
0.000 | 0.000
1.000 | 1.000
11peptides
spectra
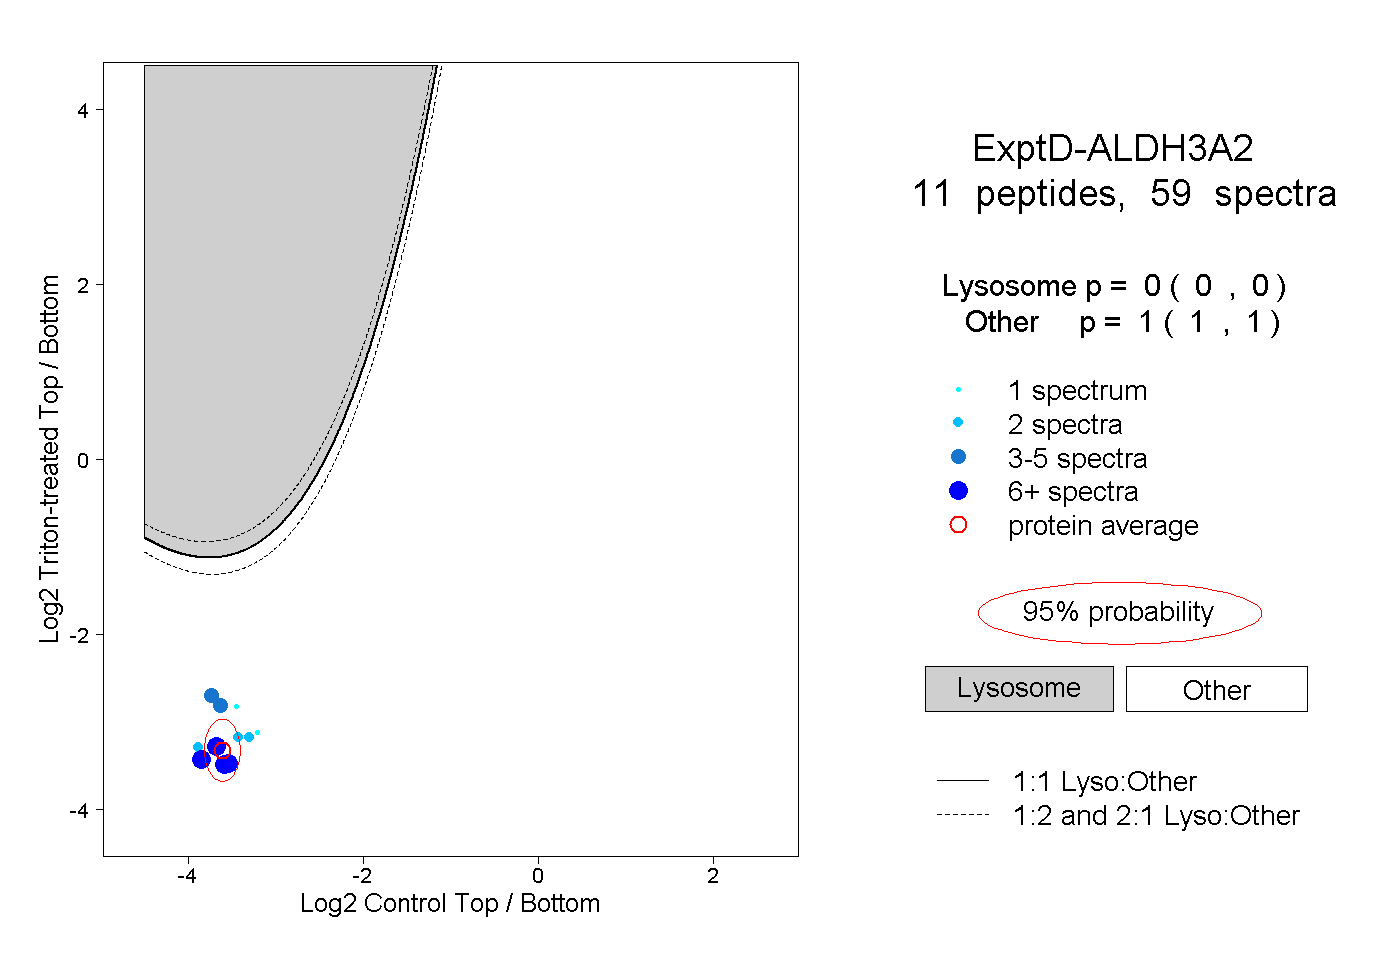
0.000 | 0.000
1.000 | 1.000