 3
3peptides
spectra
0.044 | 0.241
0.000 | 0.000
0.000 | 0.156
0.000 | 0.409
0.000 | 0.401
0.000 | 0.220
0.214 | 0.328
0.048 | 0.166
1peptide
spectrum
NA | NA
NA | NA
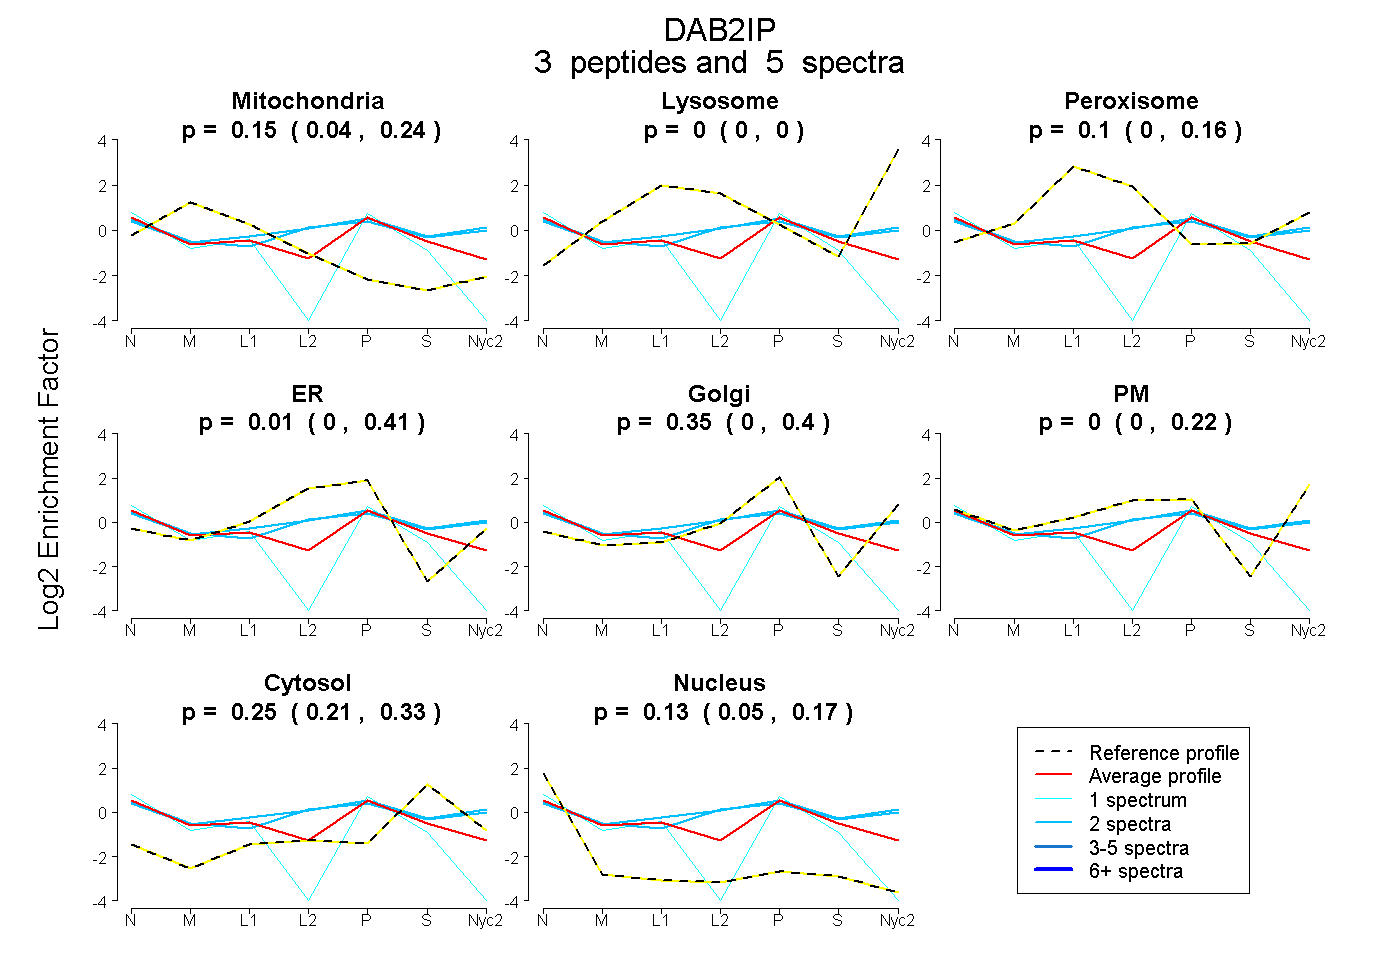
| Plot | Mito | Lyso | Perox | ER | Golgi | PM | Cytosol | Nucleus | |||||
| Expt A |
3 peptides |
5 spectra |
|
0.154 0.044 | 0.241 |
0.000 0.000 | 0.000 |
0.099 0.000 | 0.156 |
0.012 0.000 | 0.409 |
0.349 0.000 | 0.401 |
0.000 0.000 | 0.220 |
0.251 0.214 | 0.328 |
0.135 0.048 | 0.166 |
||
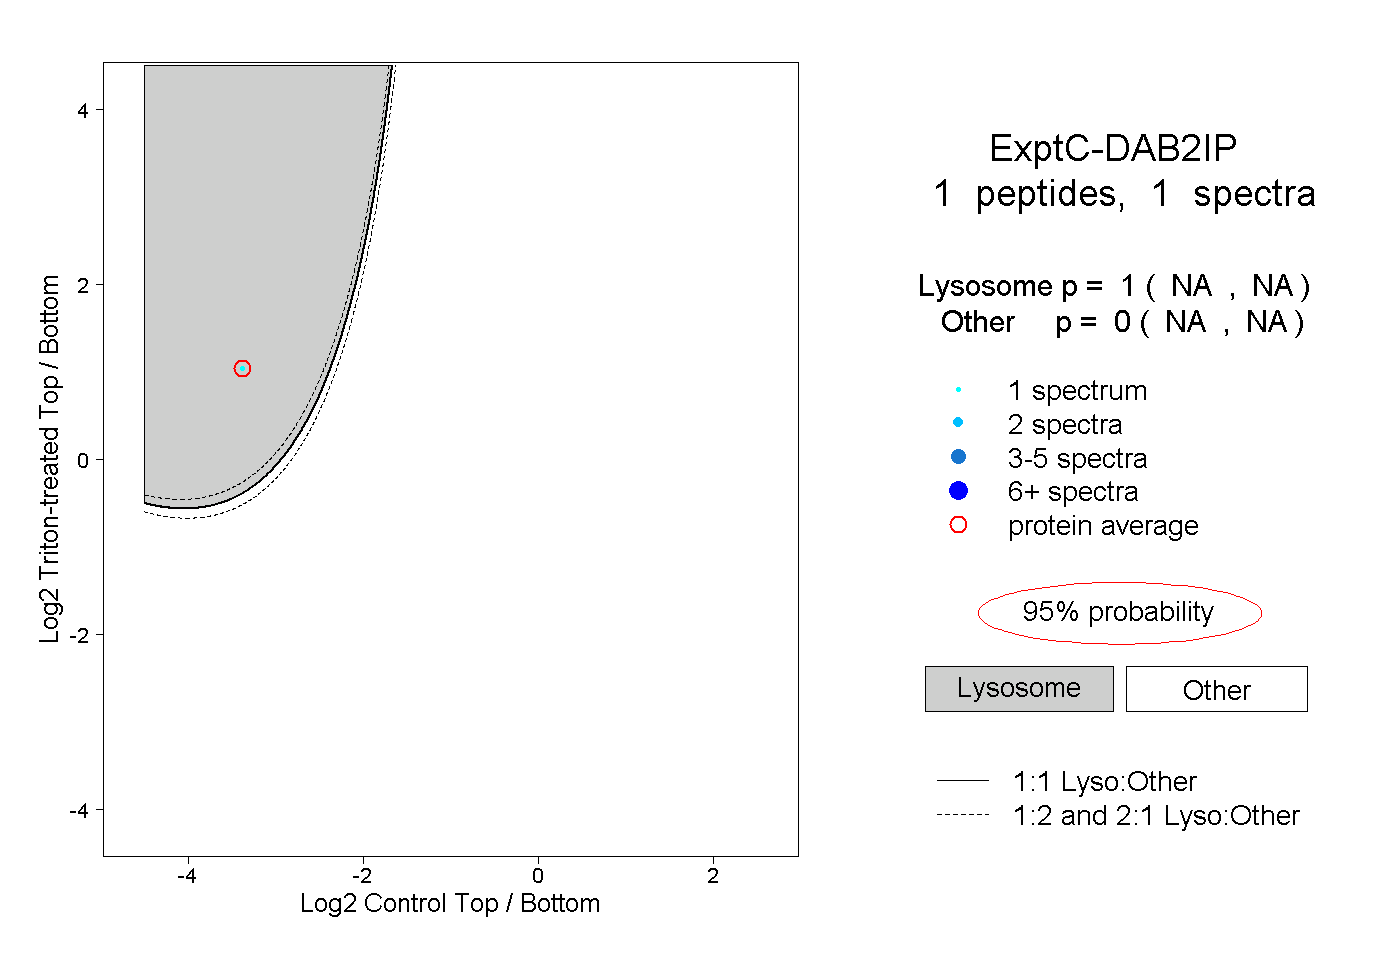
| Plot | Lyso | Other | |||||||||||
| Expt C |
1 peptide |
1 spectrum |
|
1.000 NA | NA |
0.000 NA | NA |