 4
4peptides
spectra
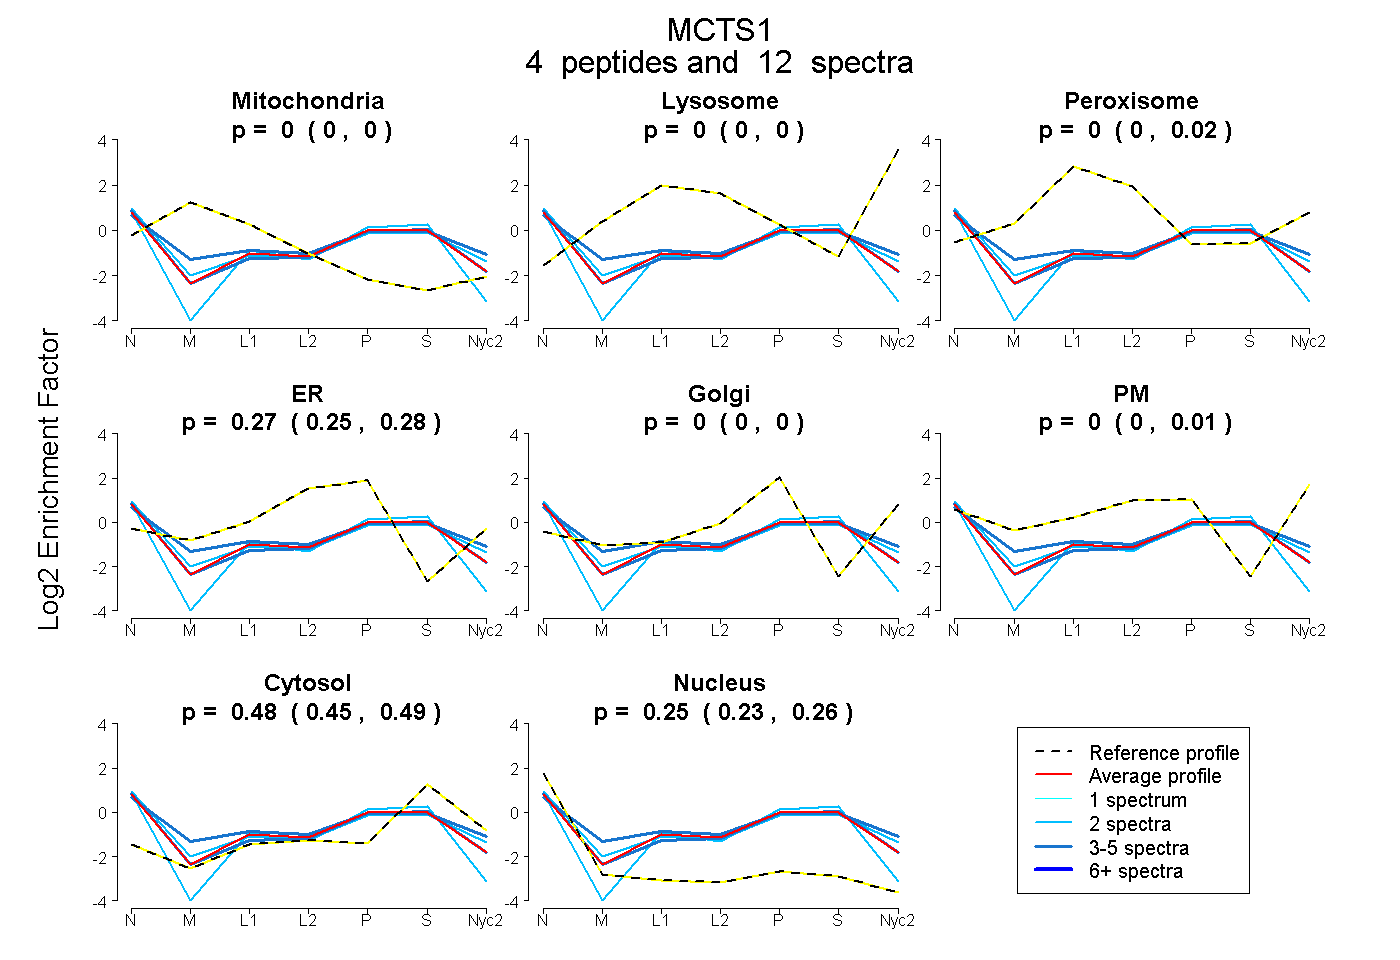
0.000 | 0.000
0.000 | 0.000
0.000 | 0.023
0.250 | 0.278
0.000 | 0.000
0.000 | 0.015
0.453 | 0.493
0.231 | 0.264
1peptide
spectra
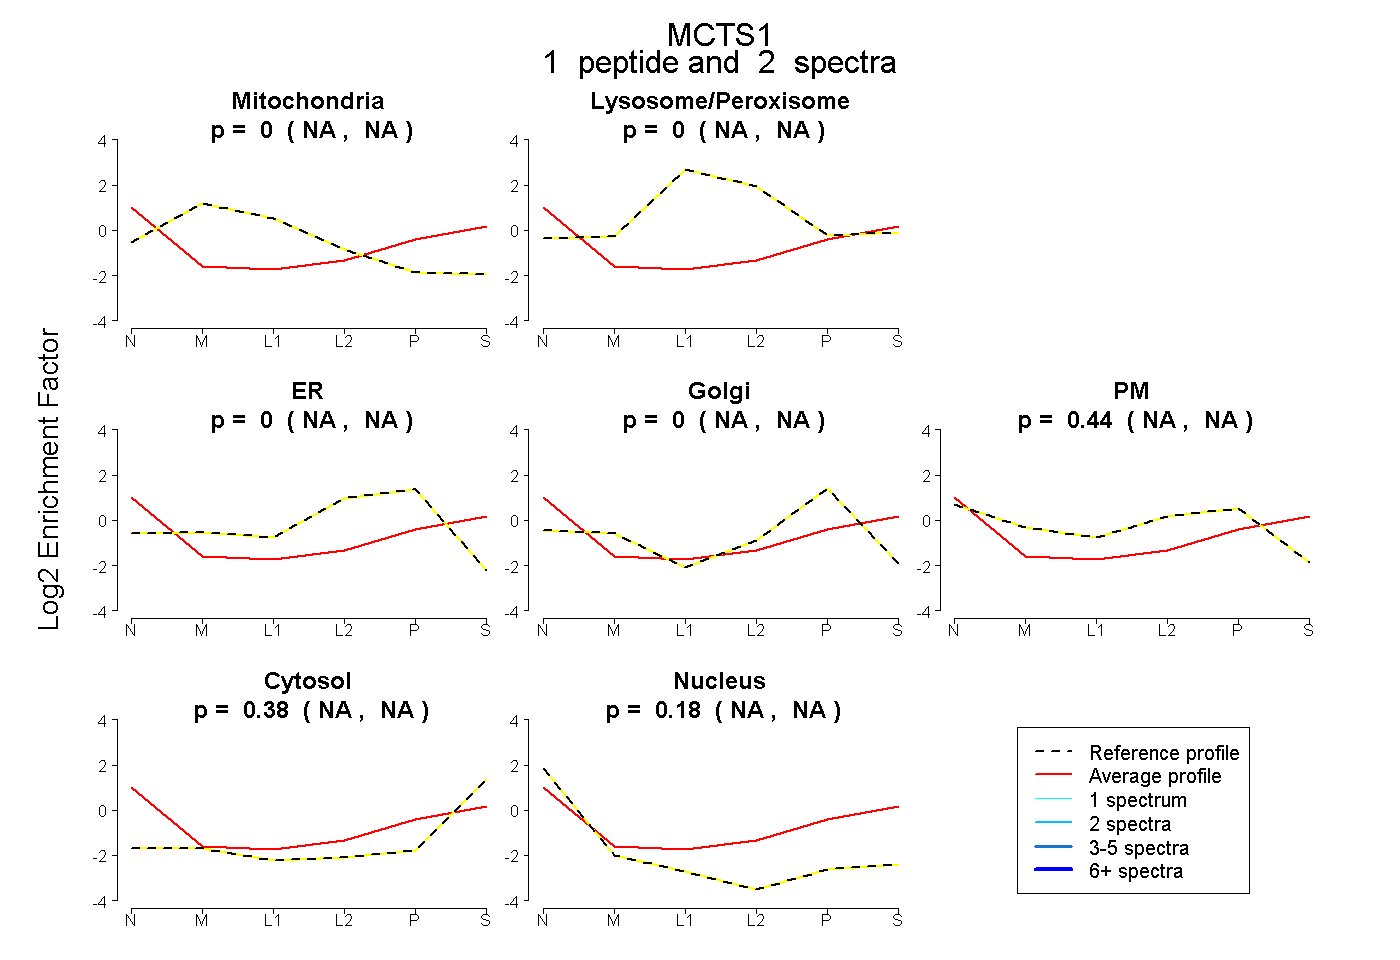
NA | NA
NA | NA
NA | NA
NA | NA
NA | NA
NA | NA
NA | NA
3peptides
spectra
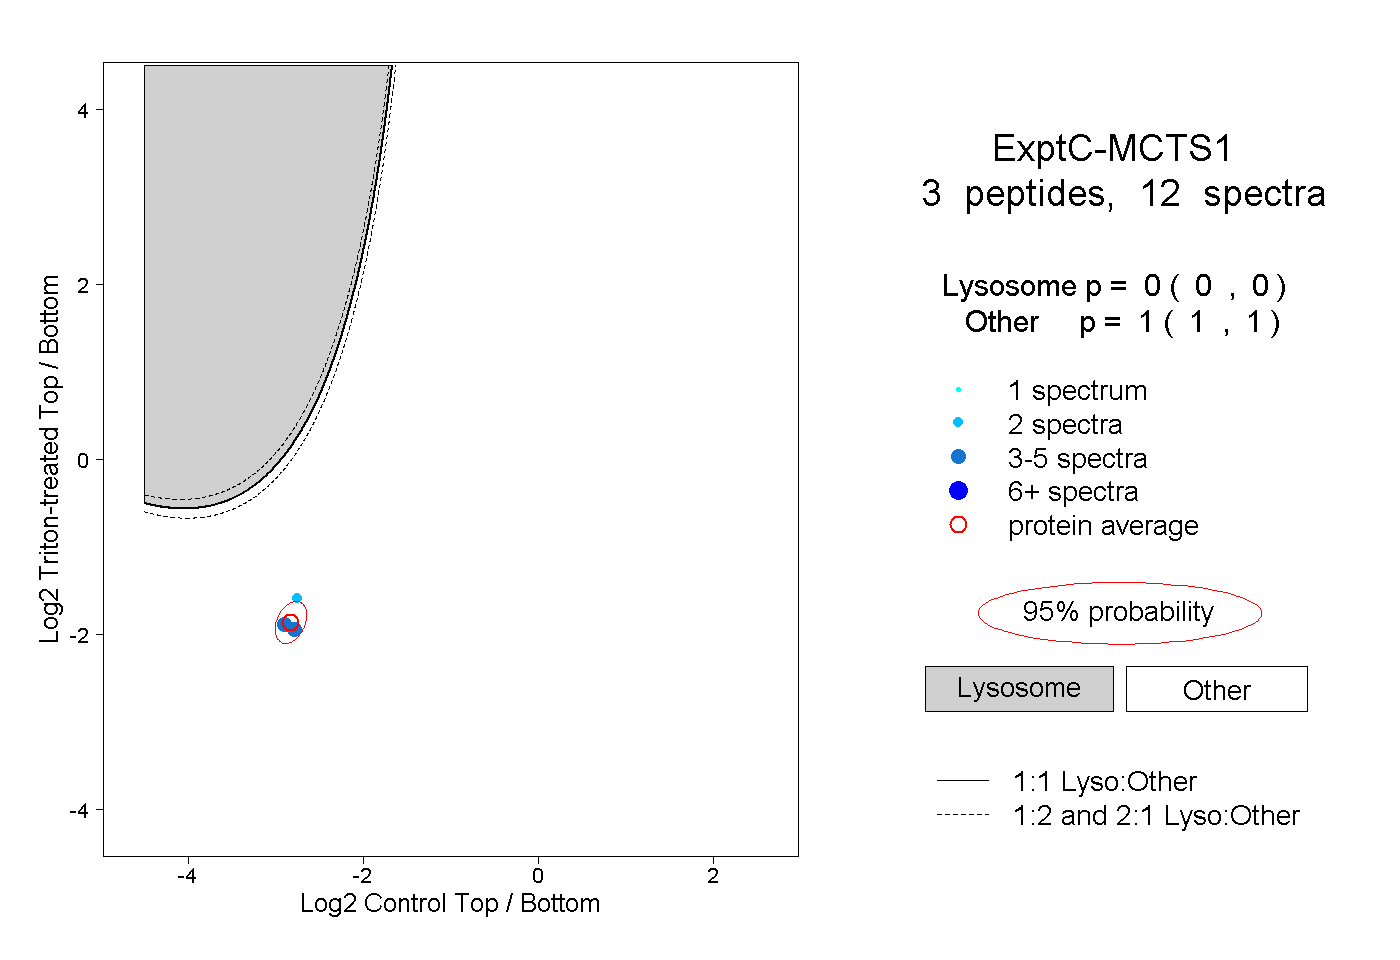
0.000 | 0.000
1.000 | 1.000
1peptide
spectrum
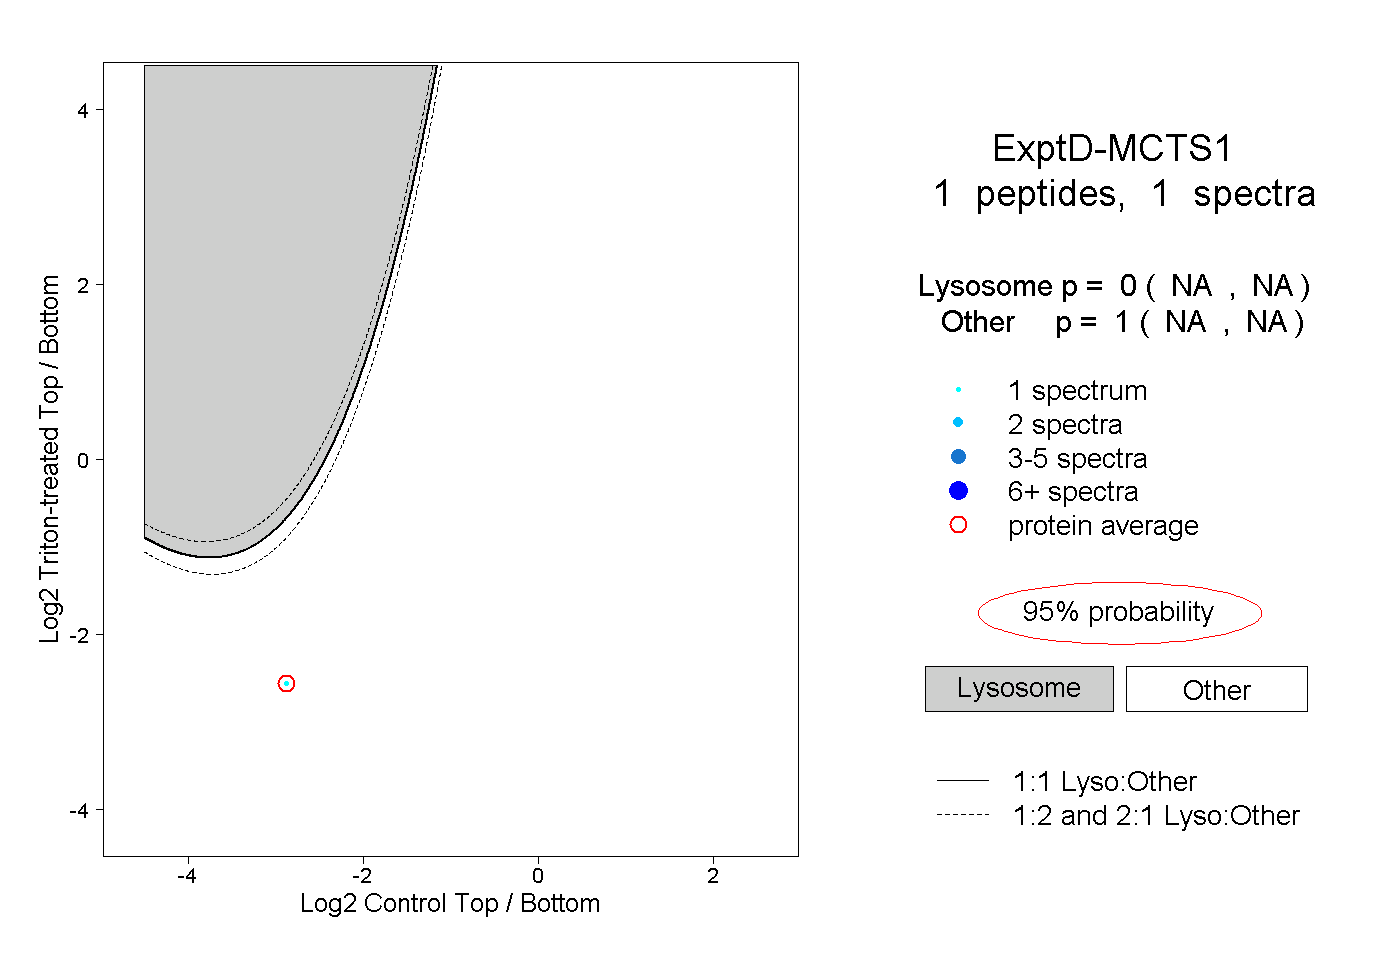
NA | NA
NA | NA