 11
11peptides
spectra
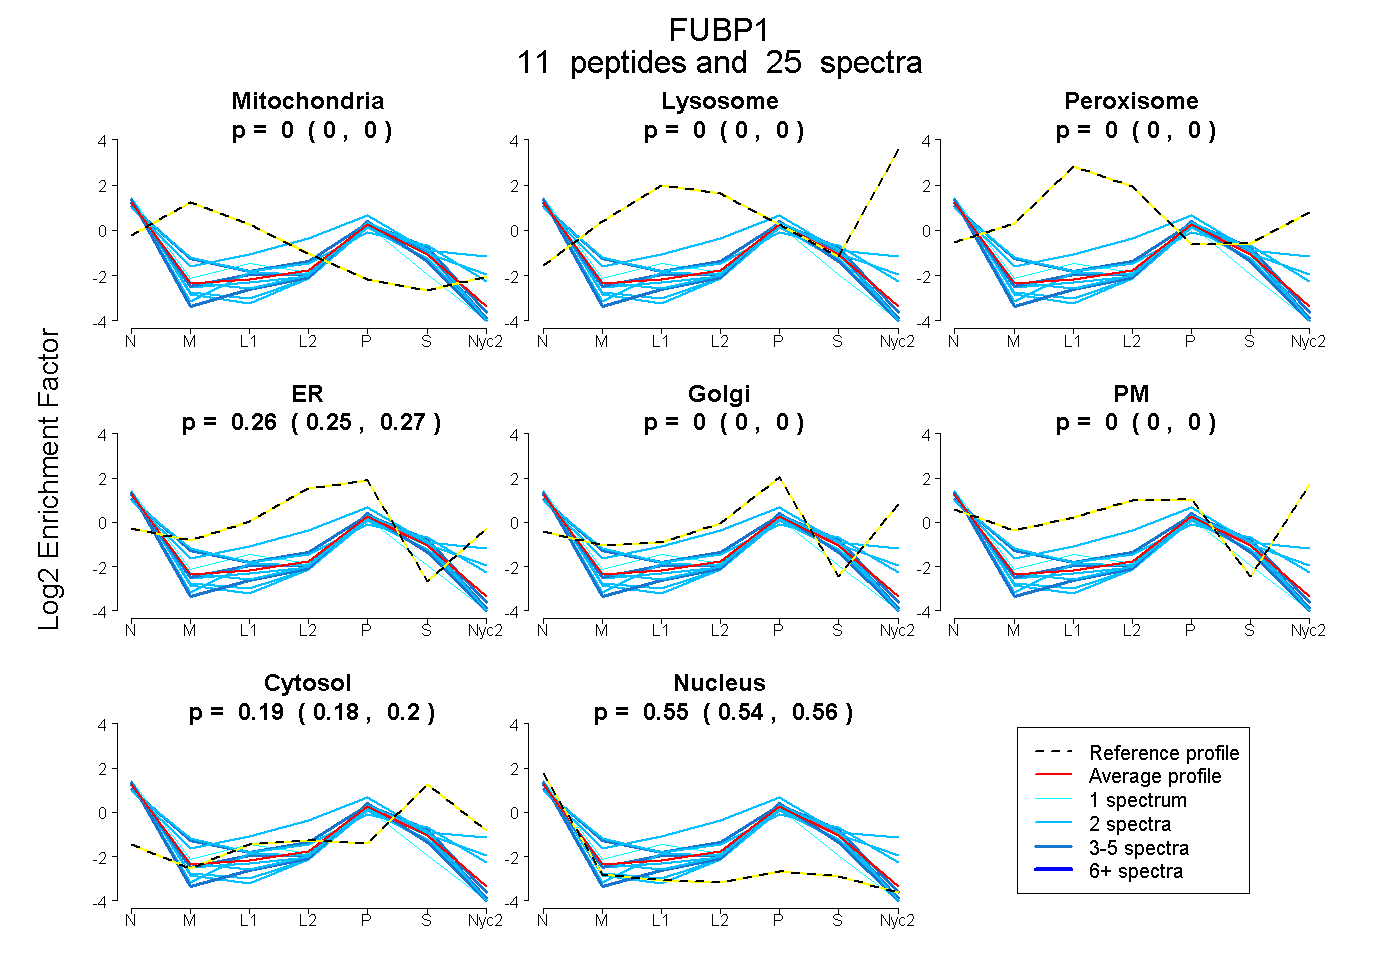
0.000 | 0.000
0.000 | 0.000
0.000 | 0.000
0.255 | 0.270
0.000 | 0.000
0.000 | 0.000
0.179 | 0.195
0.539 | 0.557
| Plot | Mito | Lyso | Perox | ER | Golgi | PM | Cytosol | Nucleus | |||||
| Expt A |
11 peptides |
25 spectra |
|
0.000 0.000 | 0.000 |
0.000 0.000 | 0.000 |
0.000 0.000 | 0.000 |
0.263 0.255 | 0.270 |
0.000 0.000 | 0.000 |
0.000 0.000 | 0.000 |
0.188 0.179 | 0.195 |
0.549 0.539 | 0.557 |
| 2 spectra, FAVGIVIGR | 0.000 | 0.000 | 0.000 | 0.155 | 0.000 | 0.000 | 0.148 | 0.697 | ||
| 2 spectra, RPLEDGDQPDAK | 0.000 | 0.000 | 0.000 | 0.000 | 0.306 | 0.000 | 0.239 | 0.455 | ||
| 3 spectra, IAQITGPPDR | 0.000 | 0.000 | 0.000 | 0.326 | 0.000 | 0.000 | 0.199 | 0.475 | ||
| 2 spectra, ITGDPYK | 0.000 | 0.000 | 0.000 | 0.383 | 0.032 | 0.113 | 0.250 | 0.222 | ||
| 3 spectra, IQIAPDSGGLPER | 0.000 | 0.000 | 0.000 | 0.226 | 0.000 | 0.000 | 0.198 | 0.576 | ||
| 2 spectra, LLDQIVEK | 0.042 | 0.000 | 0.000 | 0.237 | 0.063 | 0.000 | 0.284 | 0.375 | ||
| 4 spectra, SISQQSGAR | 0.000 | 0.000 | 0.000 | 0.199 | 0.000 | 0.000 | 0.130 | 0.671 | ||
| 2 spectra, IGGNEGIDVPIPR | 0.000 | 0.000 | 0.000 | 0.185 | 0.000 | 0.000 | 0.127 | 0.688 | ||
| 2 spectra, VPDGMVGFIIGR | 0.000 | 0.000 | 0.000 | 0.202 | 0.000 | 0.000 | 0.199 | 0.599 | ||
| 1 spectrum, CQHAAEIITDLLR | 0.000 | 0.000 | 0.000 | 0.347 | 0.000 | 0.000 | 0.000 | 0.653 | ||
| 2 spectra, GTPQQIDYAR | 0.000 | 0.000 | 0.000 | 0.208 | 0.000 | 0.000 | 0.171 | 0.621 |
| Plot | Mito | Lyso or Perox | ER | Golgi | PM | Cytosol | Nucleus | ||||||
| Expt B |
1 peptide |
1 spectrum |
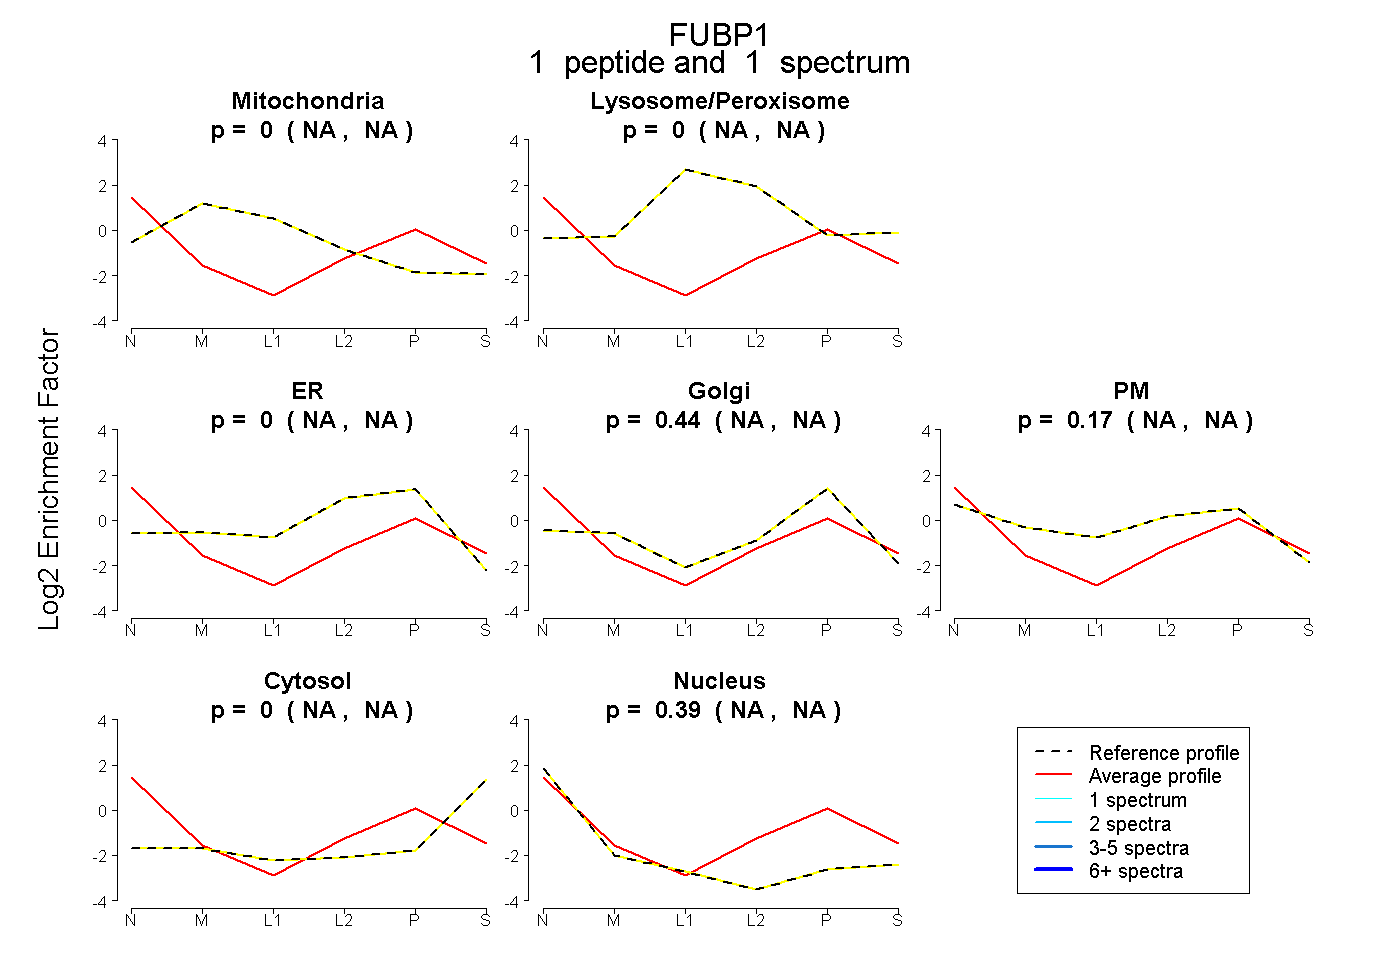 |
0.000 NA | NA |
0.000 NA | NA |
0.000 NA | NA |
0.442 NA | NA |
0.167 NA | NA |
0.000 NA | NA |
0.391 NA | NA |
|||
| Plot | Lyso | Other | |||||||||||
| Expt C |
1 peptide |
1 spectrum |
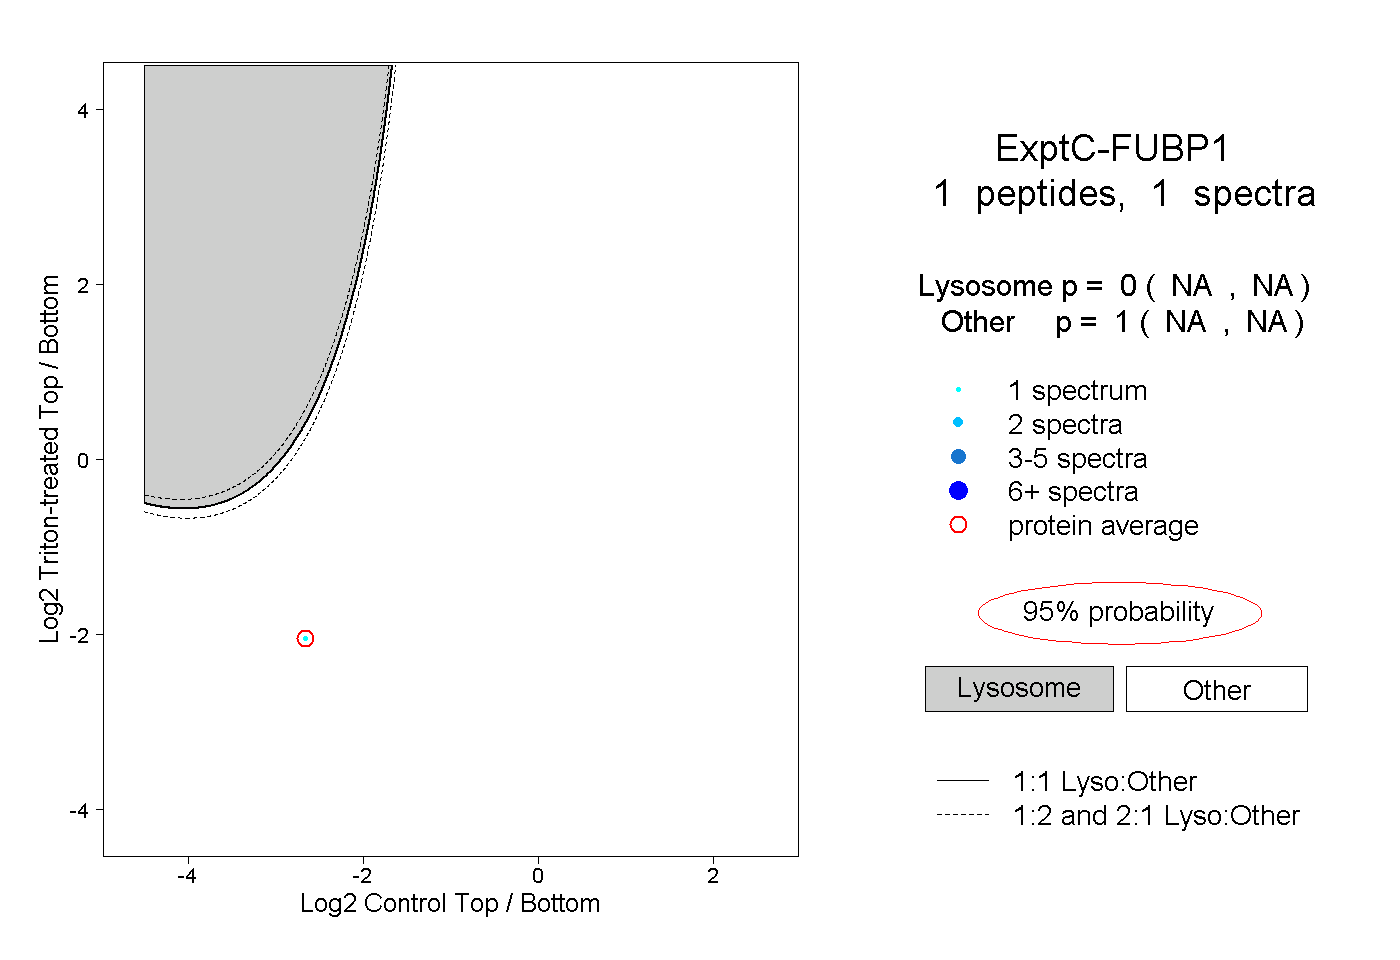 |
0.000 NA | NA |
1.000 NA | NA |