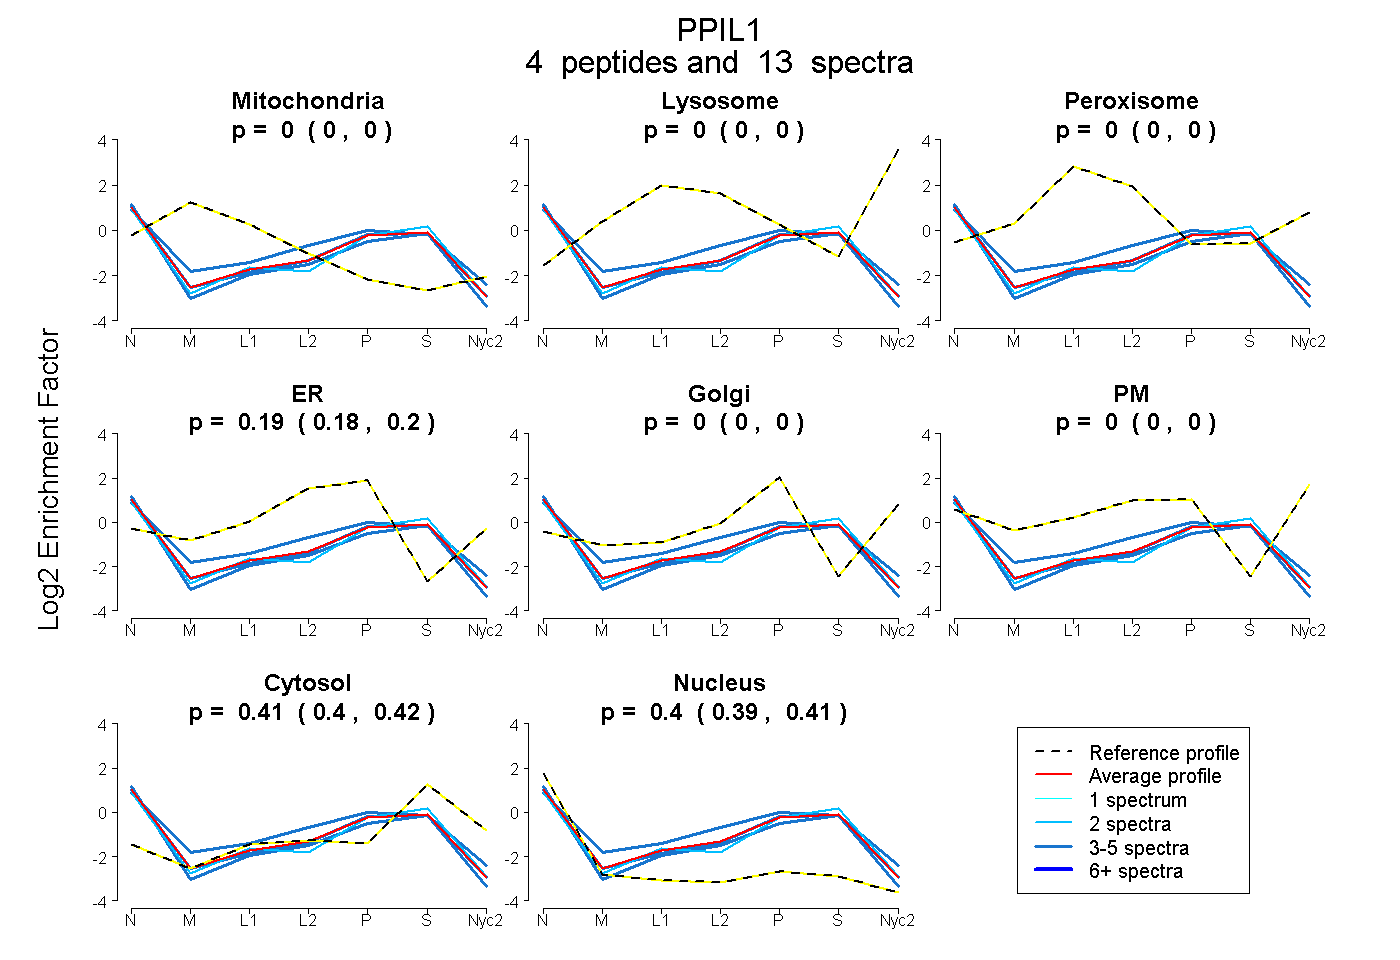
 4
4peptides
spectra
0.000 | 0.000
0.000 | 0.000
0.000 | 0.000
0.177 | 0.203
0.000 | 0.000
0.000 | 0.000
0.397 | 0.416
0.389 | 0.410
| Plot | Mito | Lyso | Perox | ER | Golgi | PM | Cytosol | Nucleus | |||||
| Expt A |
4 peptides |
13 spectra |
|
0.000 0.000 | 0.000 |
0.000 0.000 | 0.000 |
0.000 0.000 | 0.000 |
0.192 0.177 | 0.203 |
0.000 0.000 | 0.000 |
0.000 0.000 | 0.000 |
0.408 0.397 | 0.416 |
0.401 0.389 | 0.410 |
| 4 spectra, QFEDELHPDLK | 0.000 | 0.000 | 0.000 | 0.131 | 0.000 | 0.000 | 0.419 | 0.450 | ||
| 4 spectra, VCQGIGMVNR | 0.000 | 0.000 | 0.000 | 0.181 | 0.000 | 0.000 | 0.378 | 0.441 | ||
| 3 spectra, HTIFGR | 0.000 | 0.000 | 0.000 | 0.321 | 0.000 | 0.000 | 0.384 | 0.295 | ||
| 2 spectra, VGMVETNSQDRPVDDVK | 0.000 | 0.000 | 0.000 | 0.125 | 0.000 | 0.000 | 0.481 | 0.394 |
| Plot | Lyso | Other | |||||||||||
| Expt C |
2 peptides |
5 spectra |
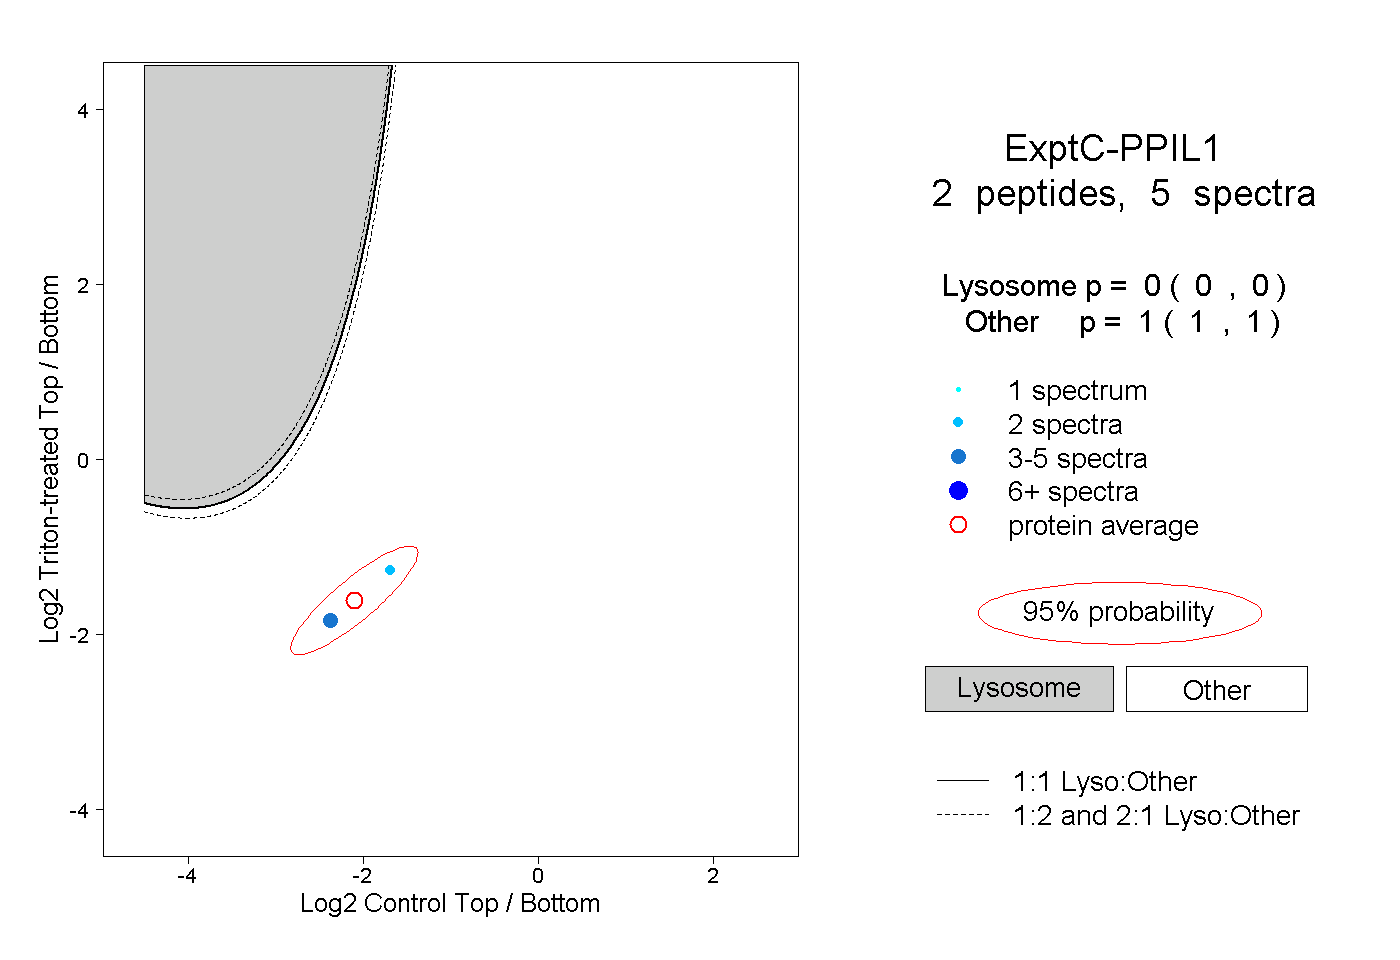 |
0.000 0.000 | 0.000 |
1.000 1.000 | 1.000 |
||||||||
| Plot | Lyso | Other | |||||||||||
| Expt D |
1 peptide |
1 spectrum |
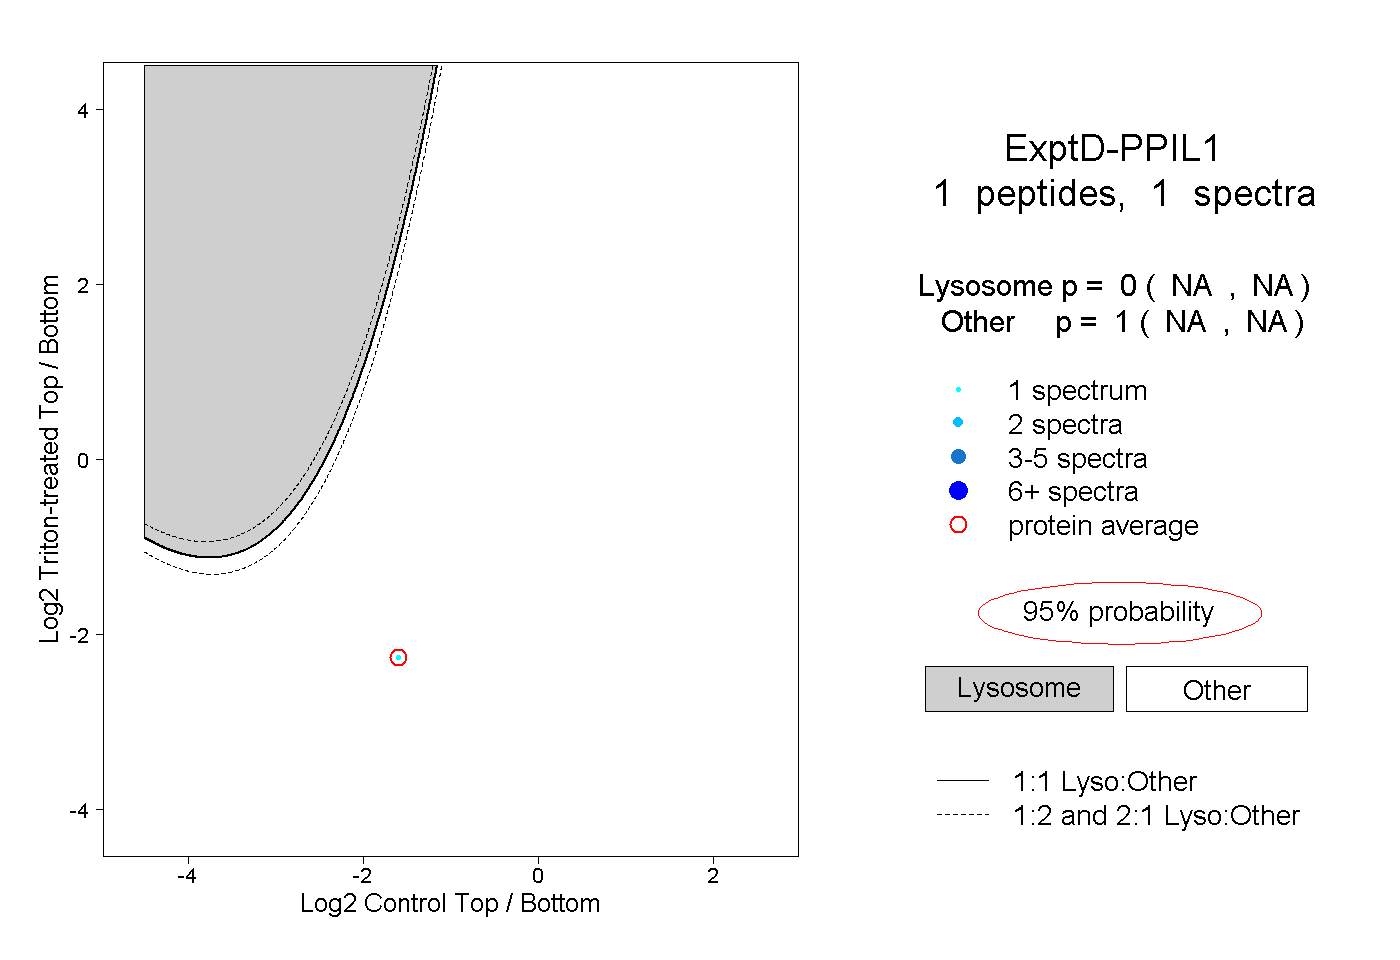 |
0.000 NA | NA |
1.000 NA | NA |