 9
9peptides
spectra
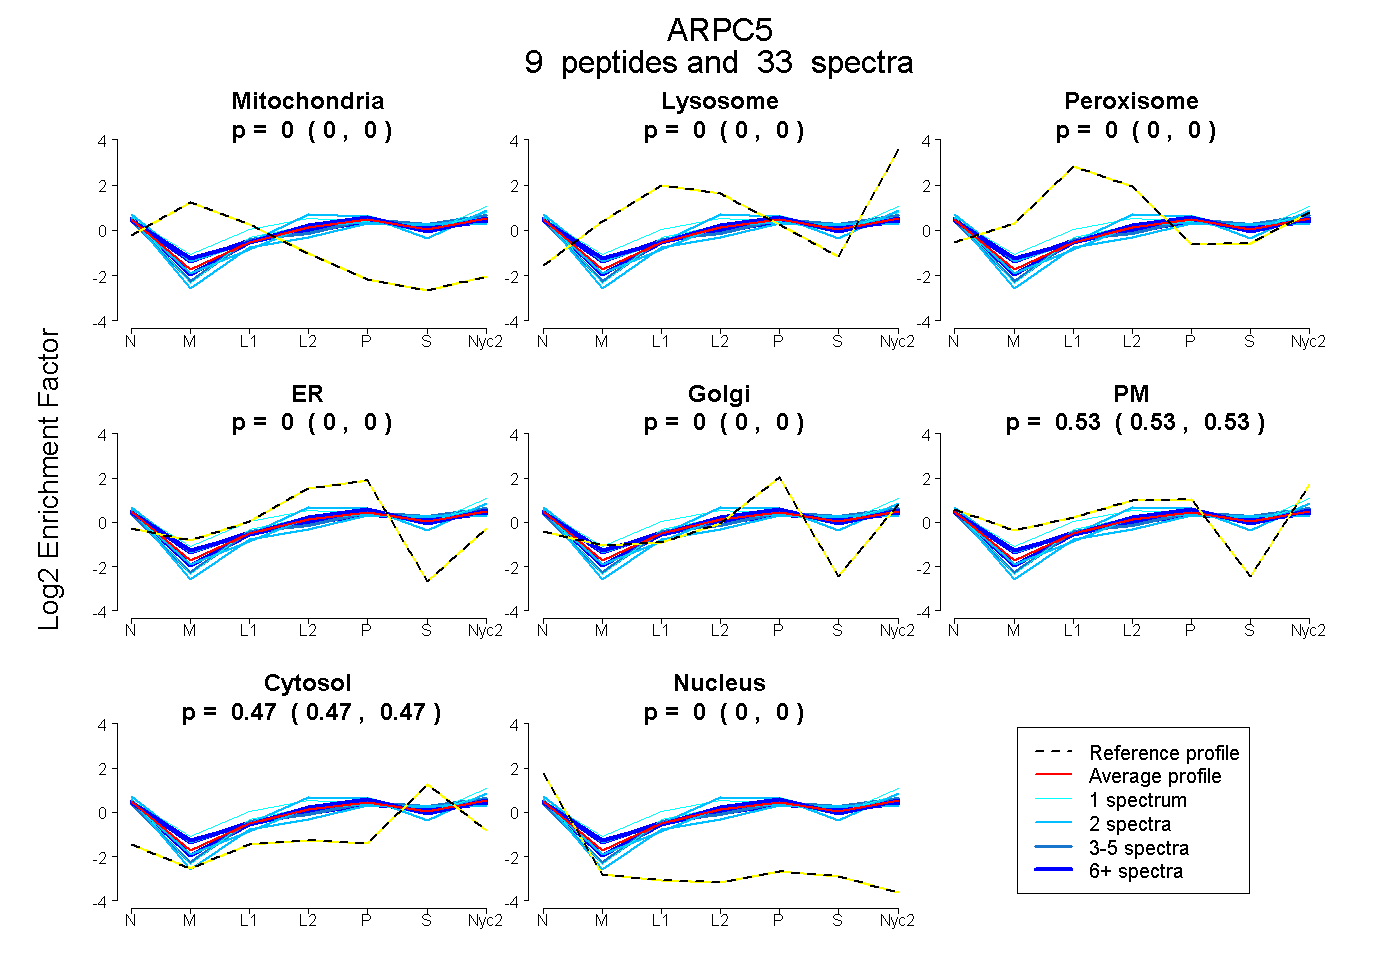
0.000 | 0.000
0.000 | 0.000
0.000 | 0.000
0.000 | 0.000
0.000 | 0.000
0.526 | 0.534
0.465 | 0.473
0.000 | 0.000
3peptides
spectra
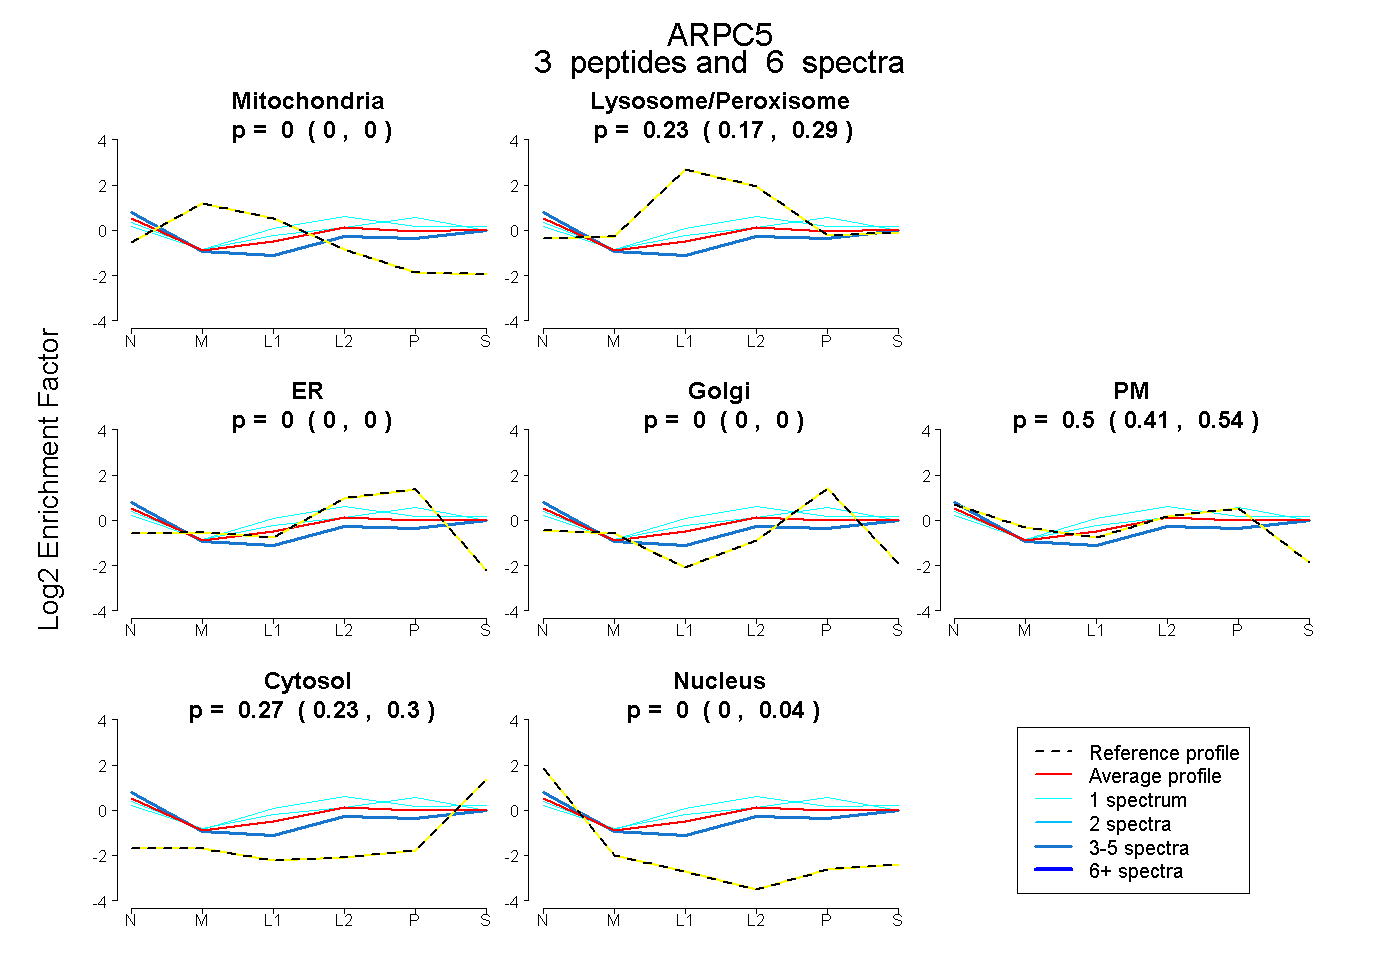
0.000 | 0.000
0.174 | 0.293
0.000 | 0.000
0.000 | 0.000
0.414 | 0.544
0.229 | 0.295
0.000 | 0.036
9peptides
spectra
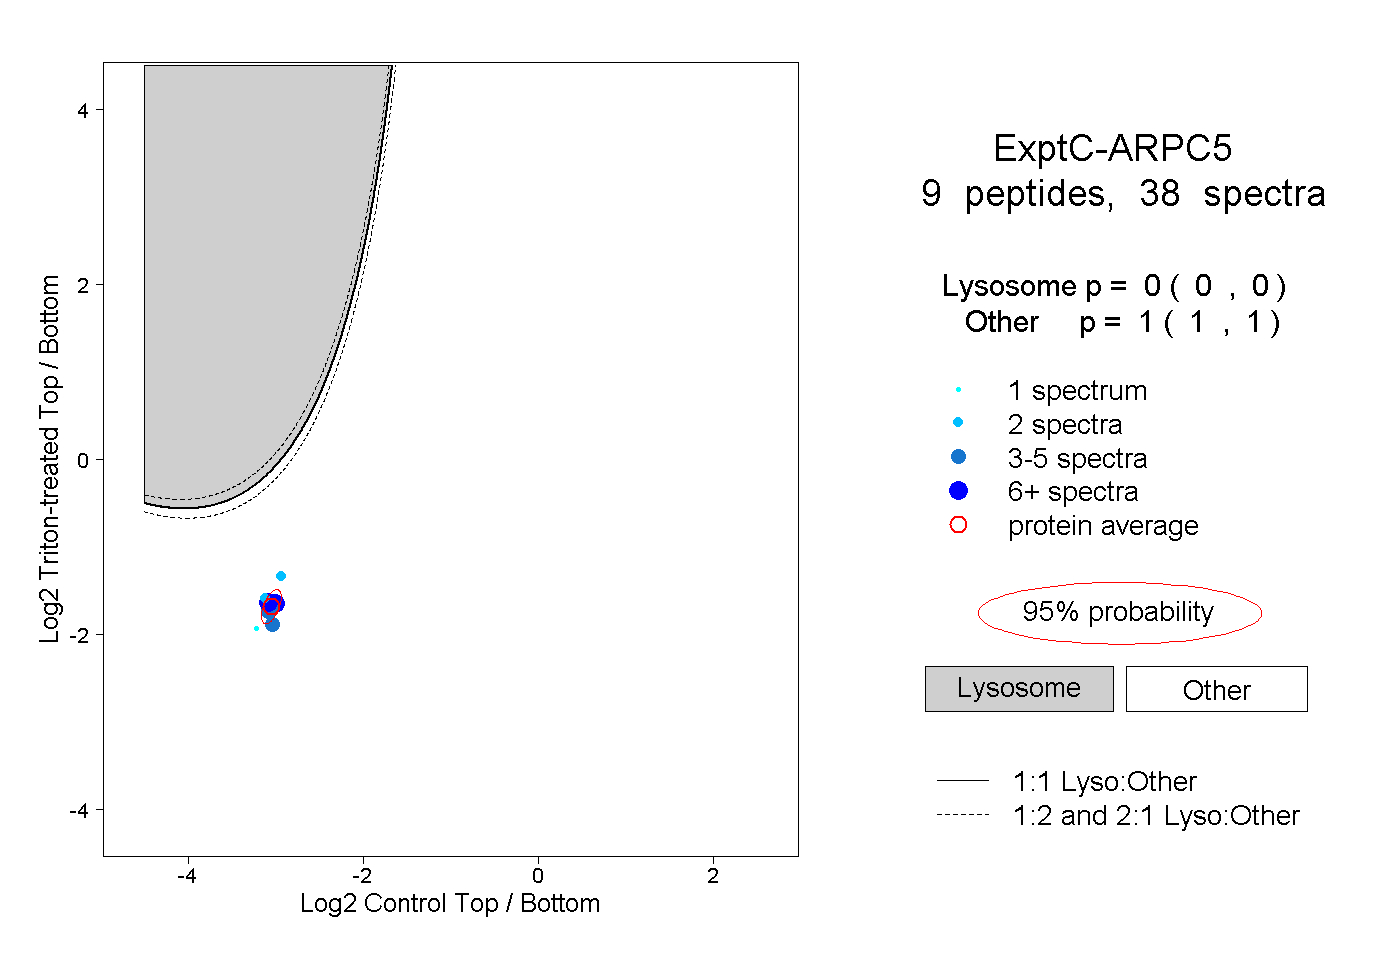
0.000 | 0.000
1.000 | 1.000
2peptides
spectra
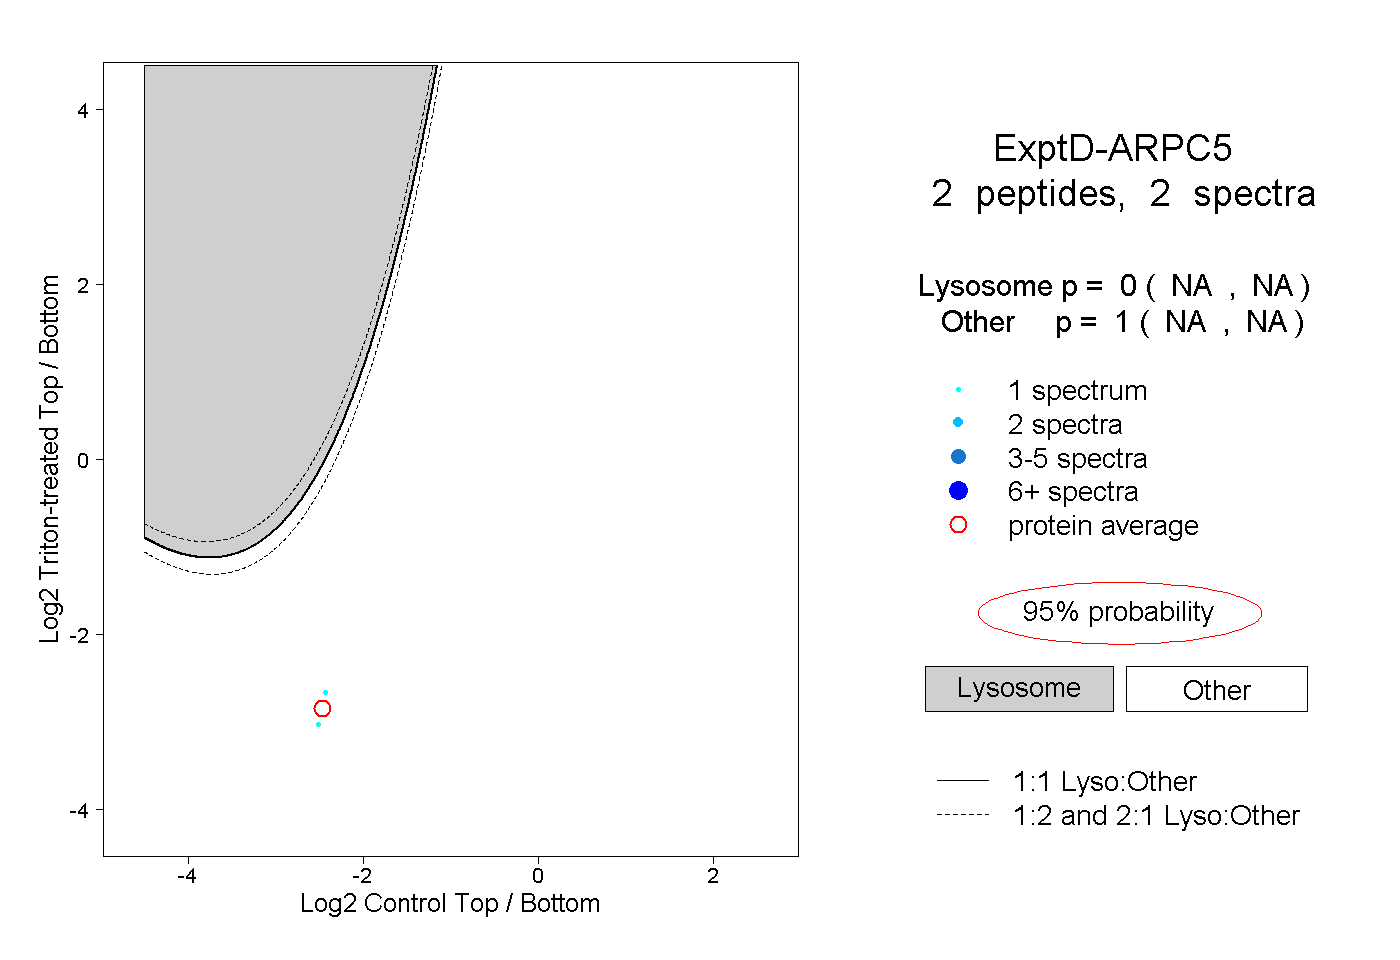
NA | NA
NA | NA