16
16peptides
spectra
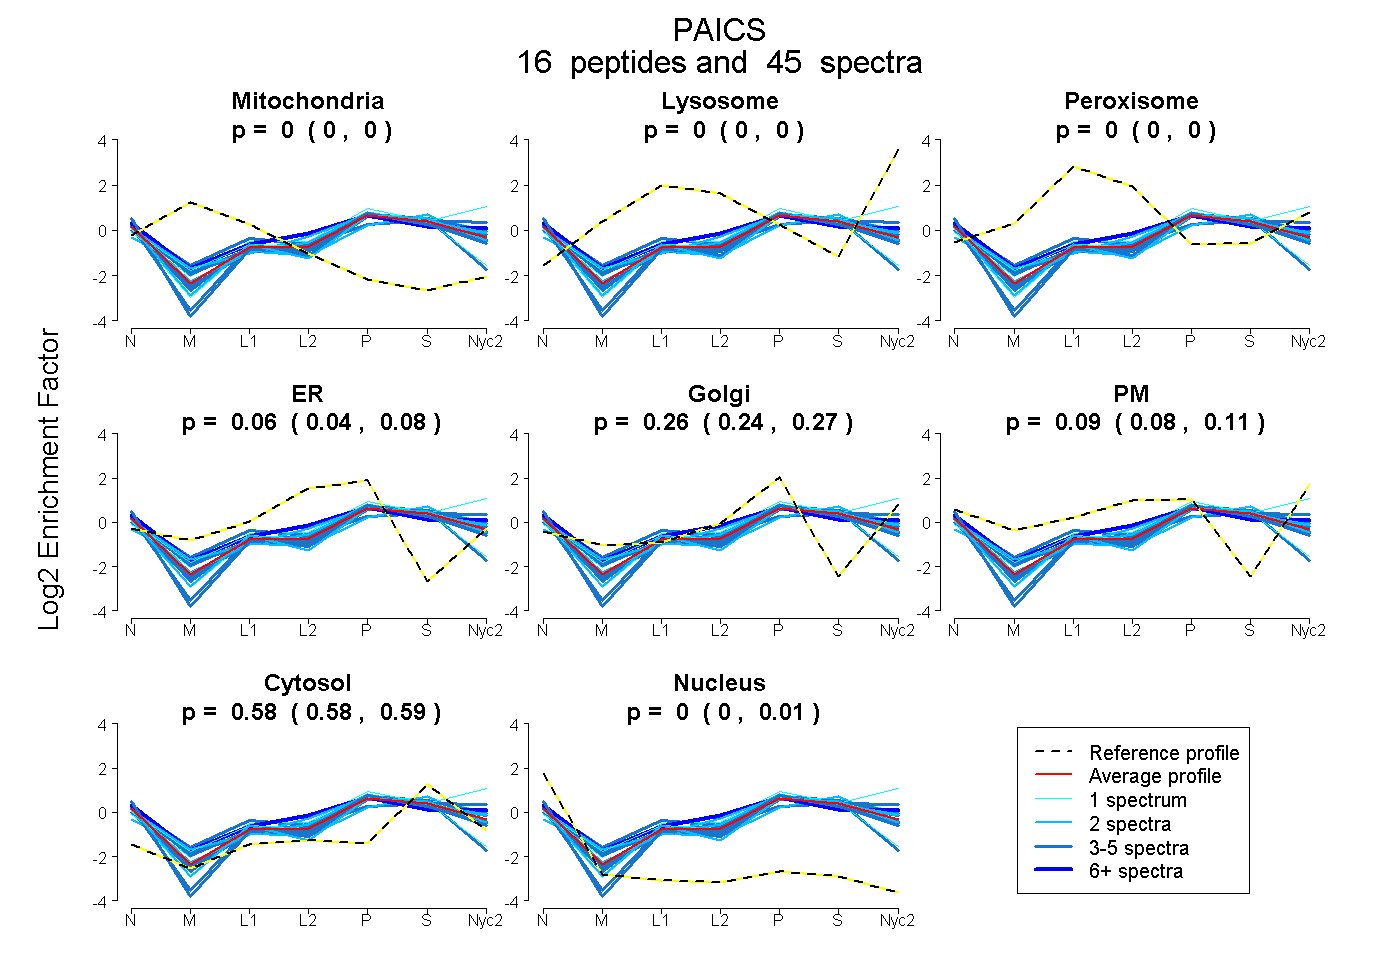
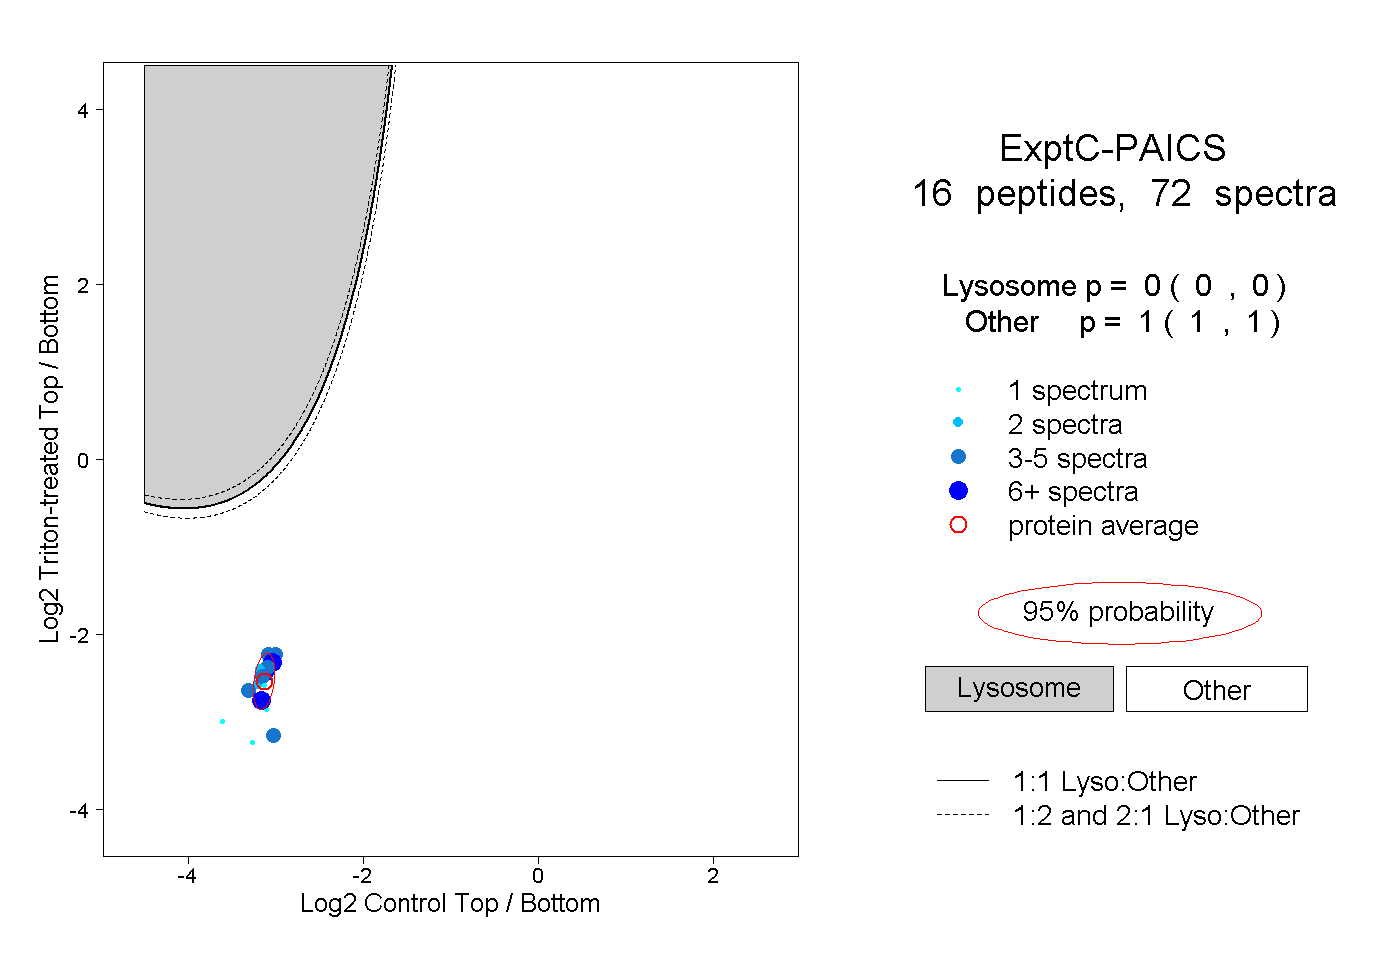
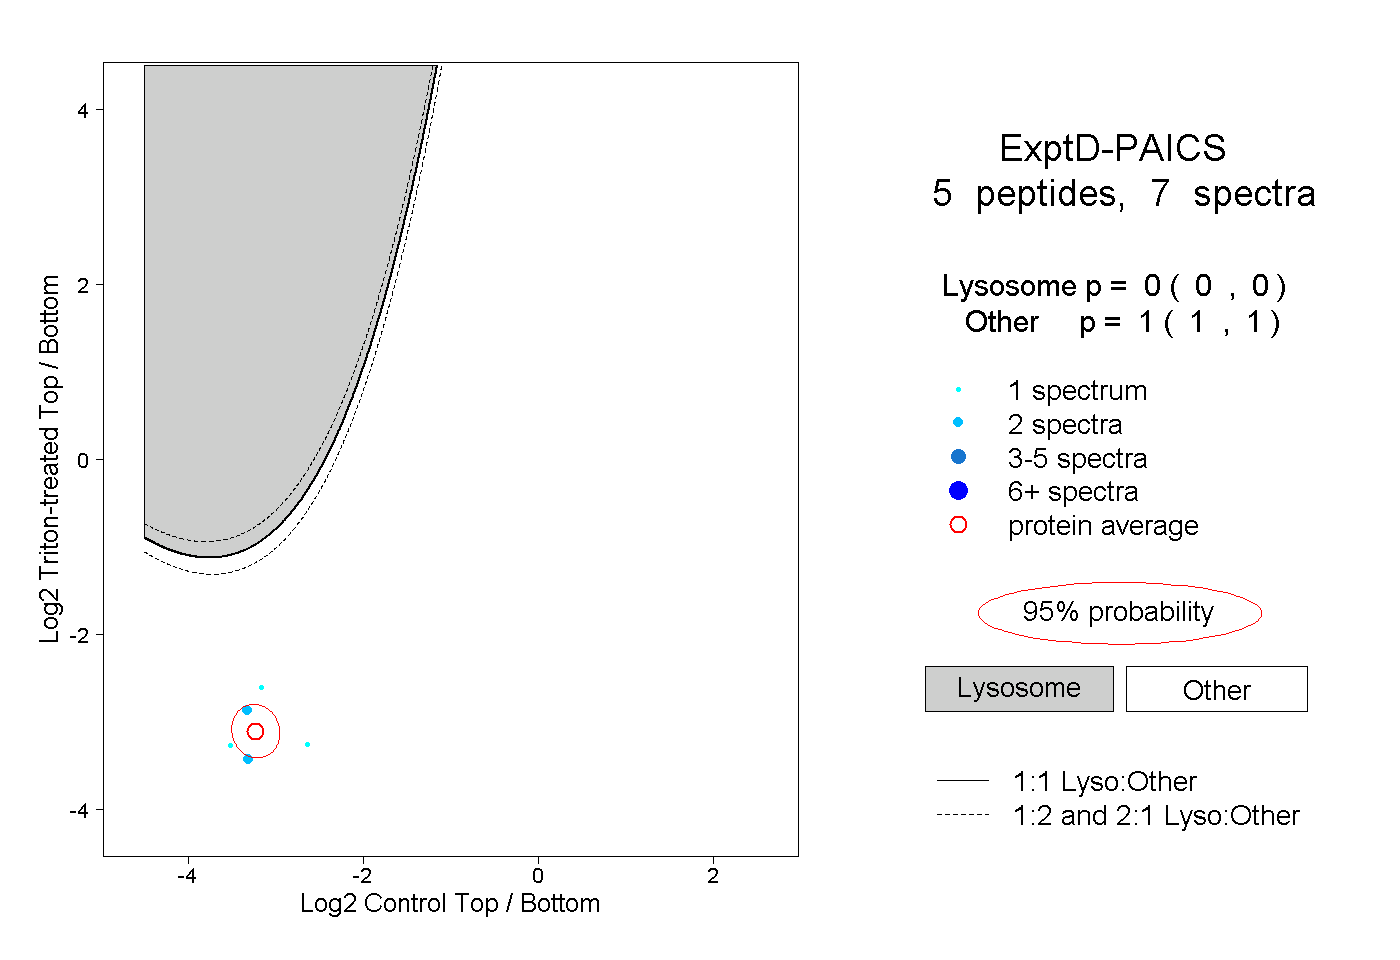
0.000 | 0.000
0.000 | 0.000
0.000 | 0.000
0.043 | 0.078
0.242 | 0.266
0.079 | 0.106
0.581 | 0.587
0.001 | 0.008
9peptides
spectra
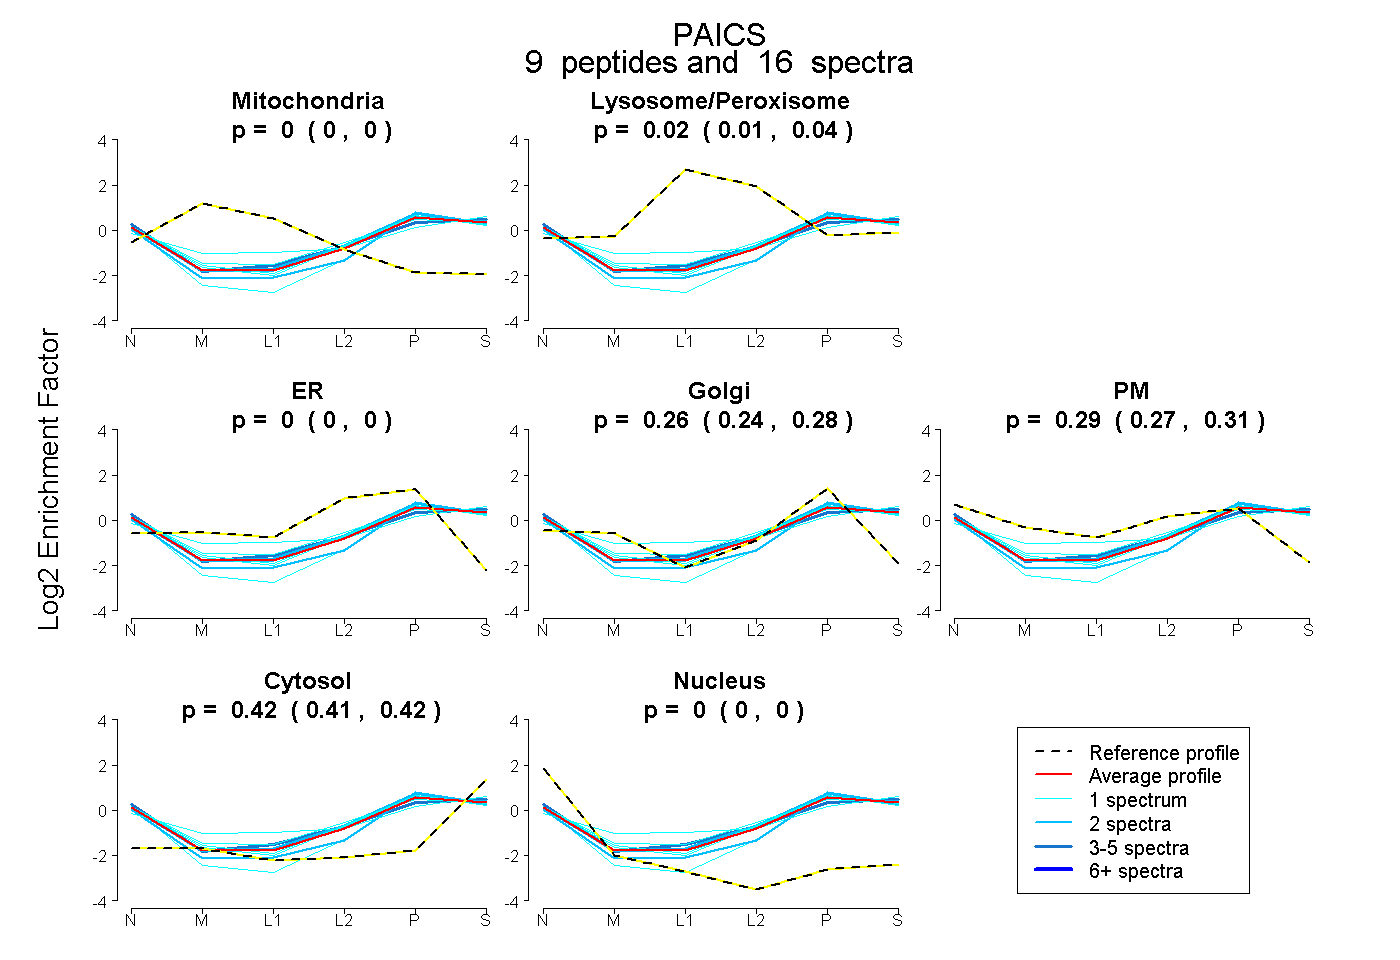
0.000 | 0.000
0.010 | 0.035
0.000 | 0.000
0.244 | 0.282
0.271 | 0.312
0.410 | 0.425
0.000 | 0.000