 16
16peptides
spectra
0.000 | 0.000
0.000 | 0.000
0.000 | 0.000
0.043 | 0.078
0.242 | 0.266
0.079 | 0.106
0.581 | 0.587
0.001 | 0.008
| Plot | Mito | Lyso | Perox | ER | Golgi | PM | Cytosol | Nucleus | |||||
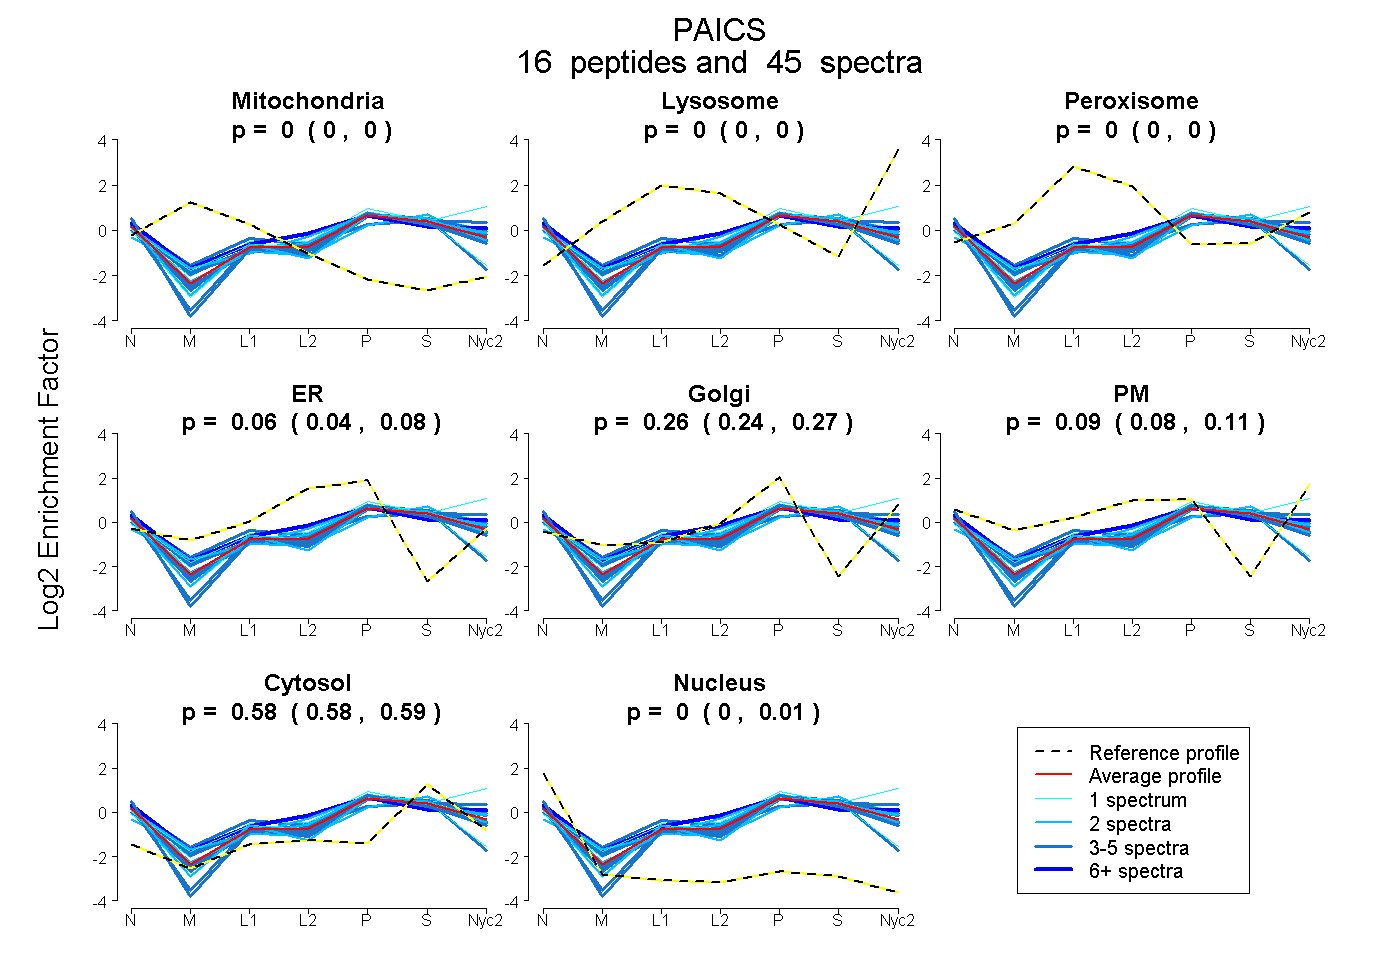
| Expt A |
16 peptides |
45 spectra |
|
0.000 0.000 | 0.000 |
0.000 0.000 | 0.000 |
0.000 0.000 | 0.000 |
0.062 0.043 | 0.078 |
0.255 0.242 | 0.266 |
0.094 0.079 | 0.106 |
0.584 0.581 | 0.587 |
0.005 0.001 | 0.008 |
| 1 spectrum, IATGSFLK | 0.000 | 0.094 | 0.000 | 0.000 | 0.262 | 0.182 | 0.462 | 0.000 | ||
| 3 spectra, IEFGVDVTTK | 0.000 | 0.000 | 0.000 | 0.072 | 0.261 | 0.085 | 0.556 | 0.026 | ||
| 5 spectra, ACGNFGIPCELR | 0.000 | 0.000 | 0.000 | 0.294 | 0.000 | 0.000 | 0.609 | 0.096 | ||
| 2 spectra, VEMFFK | 0.000 | 0.000 | 0.000 | 0.024 | 0.327 | 0.104 | 0.545 | 0.000 | ||
| 4 spectra, EVYELLDSPGR | 0.000 | 0.000 | 0.000 | 0.000 | 0.348 | 0.000 | 0.648 | 0.004 | ||
| 3 spectra, VLLQSK | 0.000 | 0.000 | 0.000 | 0.056 | 0.310 | 0.000 | 0.569 | 0.065 | ||
| 2 spectra, EVTPEGLQMVK | 0.000 | 0.000 | 0.040 | 0.000 | 0.294 | 0.010 | 0.653 | 0.003 | ||
| 3 spectra, EIVLADVIDNDSWR | 0.000 | 0.000 | 0.015 | 0.000 | 0.000 | 0.429 | 0.556 | 0.000 | ||
| 2 spectra, NFEWVADR | 0.000 | 0.000 | 0.000 | 0.084 | 0.189 | 0.190 | 0.538 | 0.000 | ||
| 3 spectra, DQITAGNAAR | 0.000 | 0.000 | 0.000 | 0.000 | 0.286 | 0.136 | 0.559 | 0.019 | ||
| 1 spectrum, SWLPQNCTLVDMK | 0.000 | 0.000 | 0.000 | 0.365 | 0.000 | 0.000 | 0.571 | 0.064 | ||
| 1 spectrum, AEYEGDGIPTVFVAVAGR | 0.000 | 0.000 | 0.000 | 0.000 | 0.287 | 0.102 | 0.611 | 0.000 | ||
| 6 spectra, LNTWISLK | 0.000 | 0.000 | 0.000 | 0.087 | 0.060 | 0.355 | 0.499 | 0.000 | ||
| 2 spectra, VTSAHK | 0.000 | 0.000 | 0.000 | 0.000 | 0.356 | 0.000 | 0.620 | 0.023 | ||
| 3 spectra, LWPSGDR | 0.000 | 0.000 | 0.000 | 0.094 | 0.279 | 0.072 | 0.550 | 0.005 | ||
| 4 spectra, GPDETLR | 0.000 | 0.000 | 0.000 | 0.187 | 0.198 | 0.019 | 0.559 | 0.037 |
| Plot | Mito | Lyso or Perox | ER | Golgi | PM | Cytosol | Nucleus | ||||||
| Expt B |
9 peptides |
16 spectra |
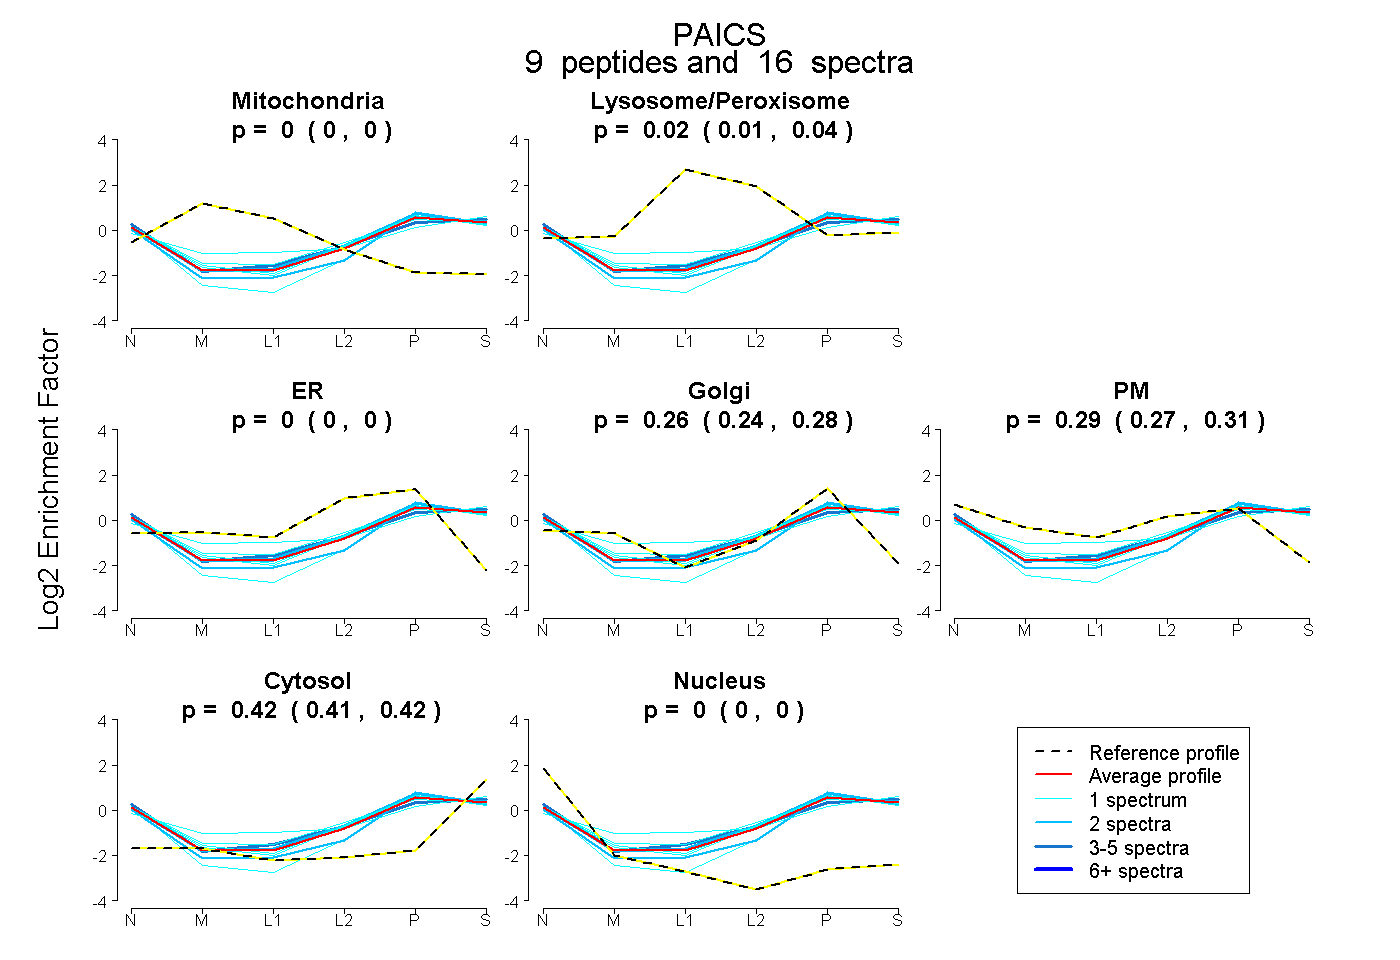 |
0.000 0.000 | 0.000 |
0.024 0.010 | 0.035 |
0.000 0.000 | 0.000 |
0.264 0.244 | 0.282 |
0.294 0.271 | 0.312 |
0.418 0.410 | 0.425 |
0.000 0.000 | 0.000 |
|||
| Plot | Lyso | Other | |||||||||||
| Expt C |
16 peptides |
72 spectra |
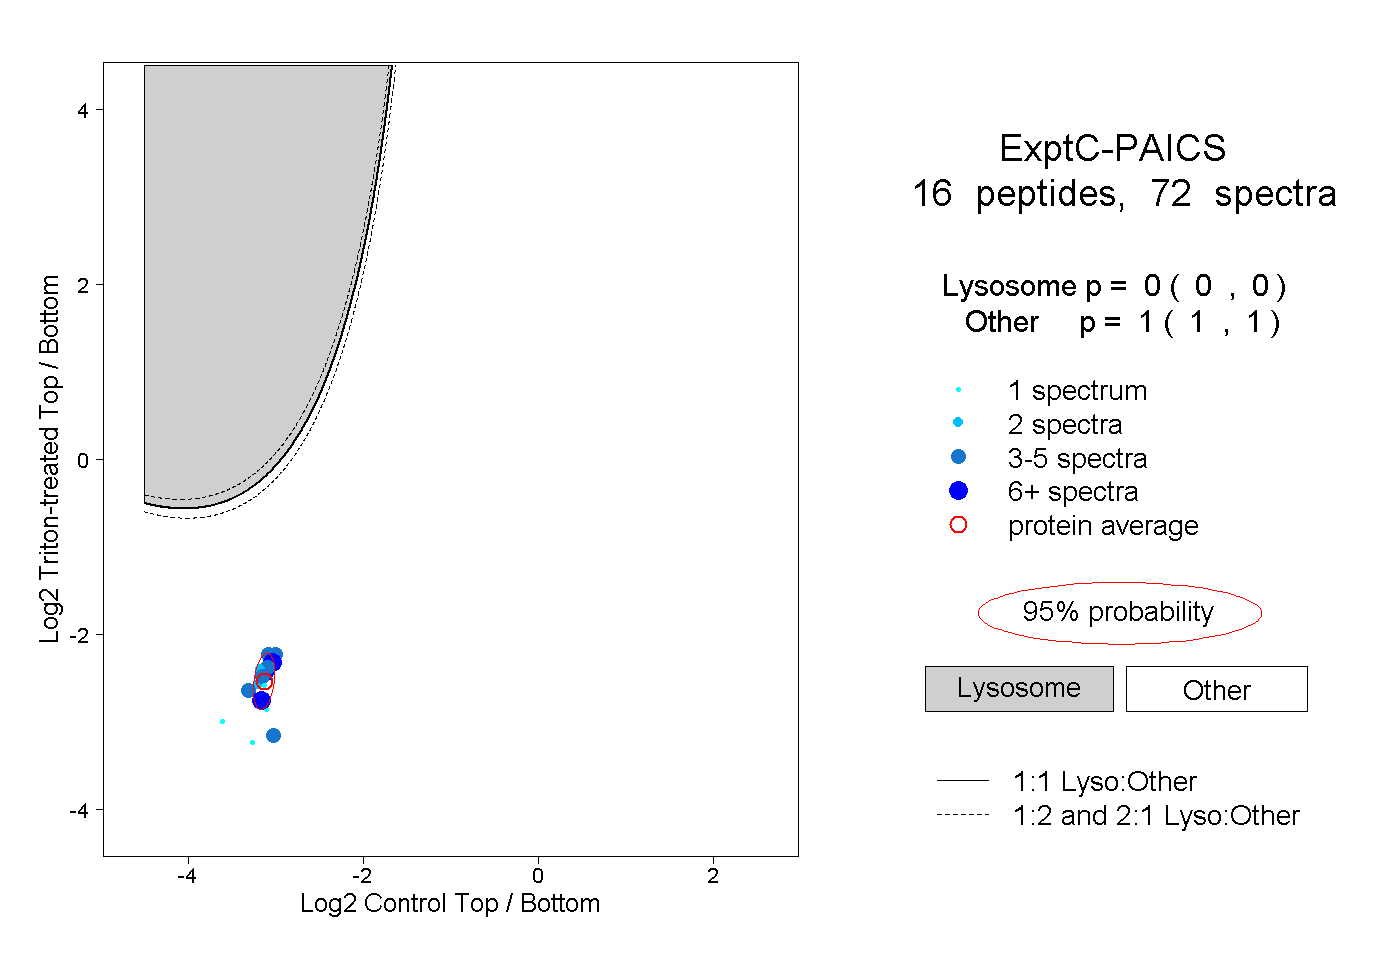 |
0.000 0.000 | 0.000 |
1.000 1.000 | 1.000 |
||||||||
| Plot | Lyso | Other | |||||||||||
| Expt D |
5 peptides |
7 spectra |
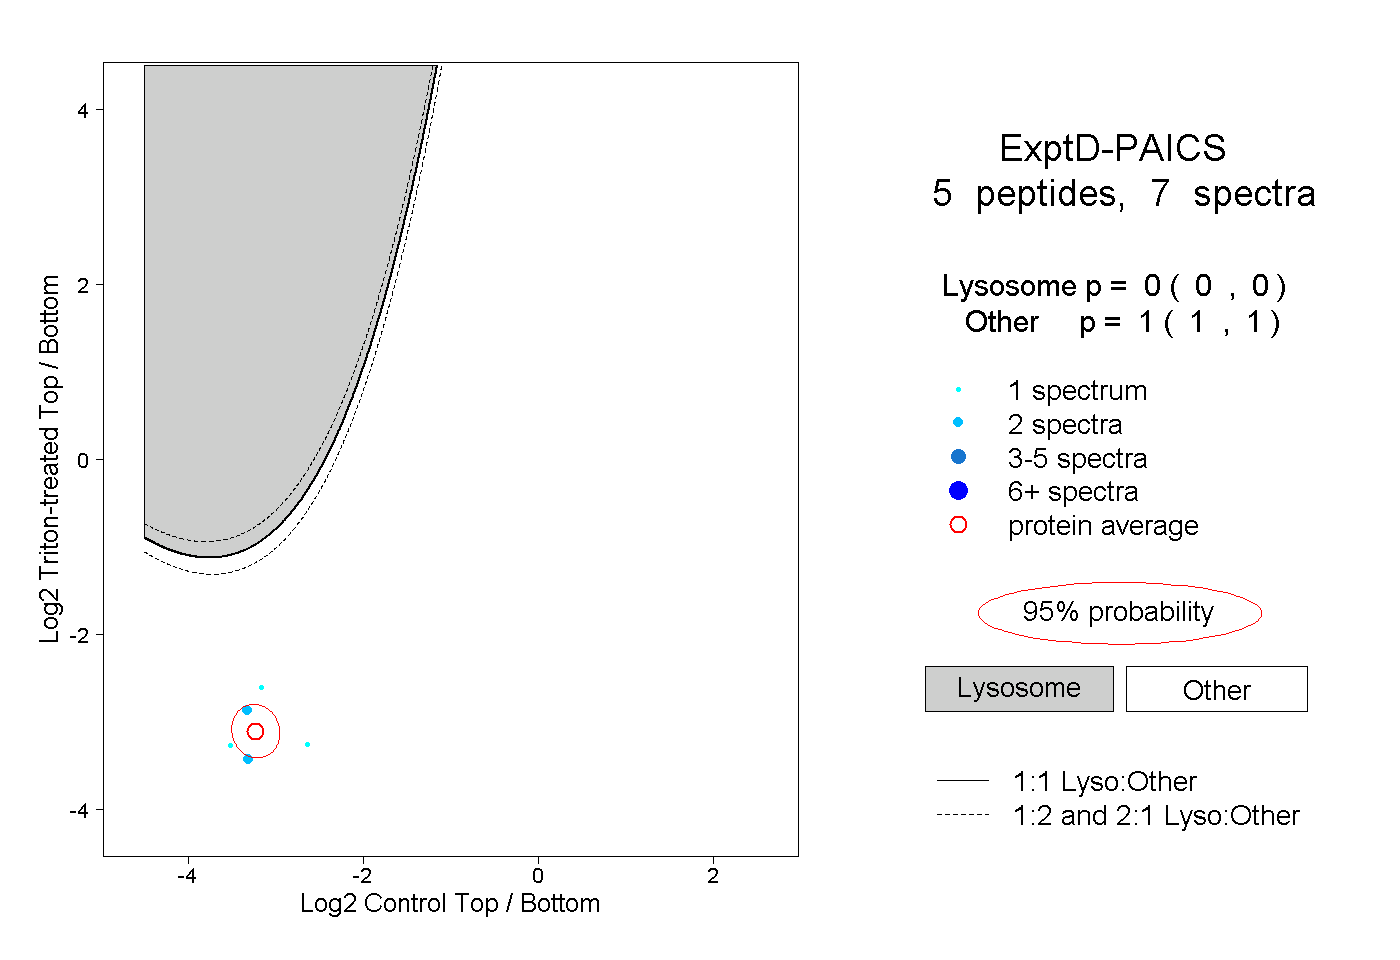 |
0.000 0.000 | 0.000 |
1.000 1.000 | 1.000 |