 3
3peptides
spectra
0.000 | 0.000
0.000 | 0.000
0.000 | 0.000
0.000 | 0.000
0.000 | 0.000
0.000 | 0.000
0.719 | 0.837
0.154 | 0.273
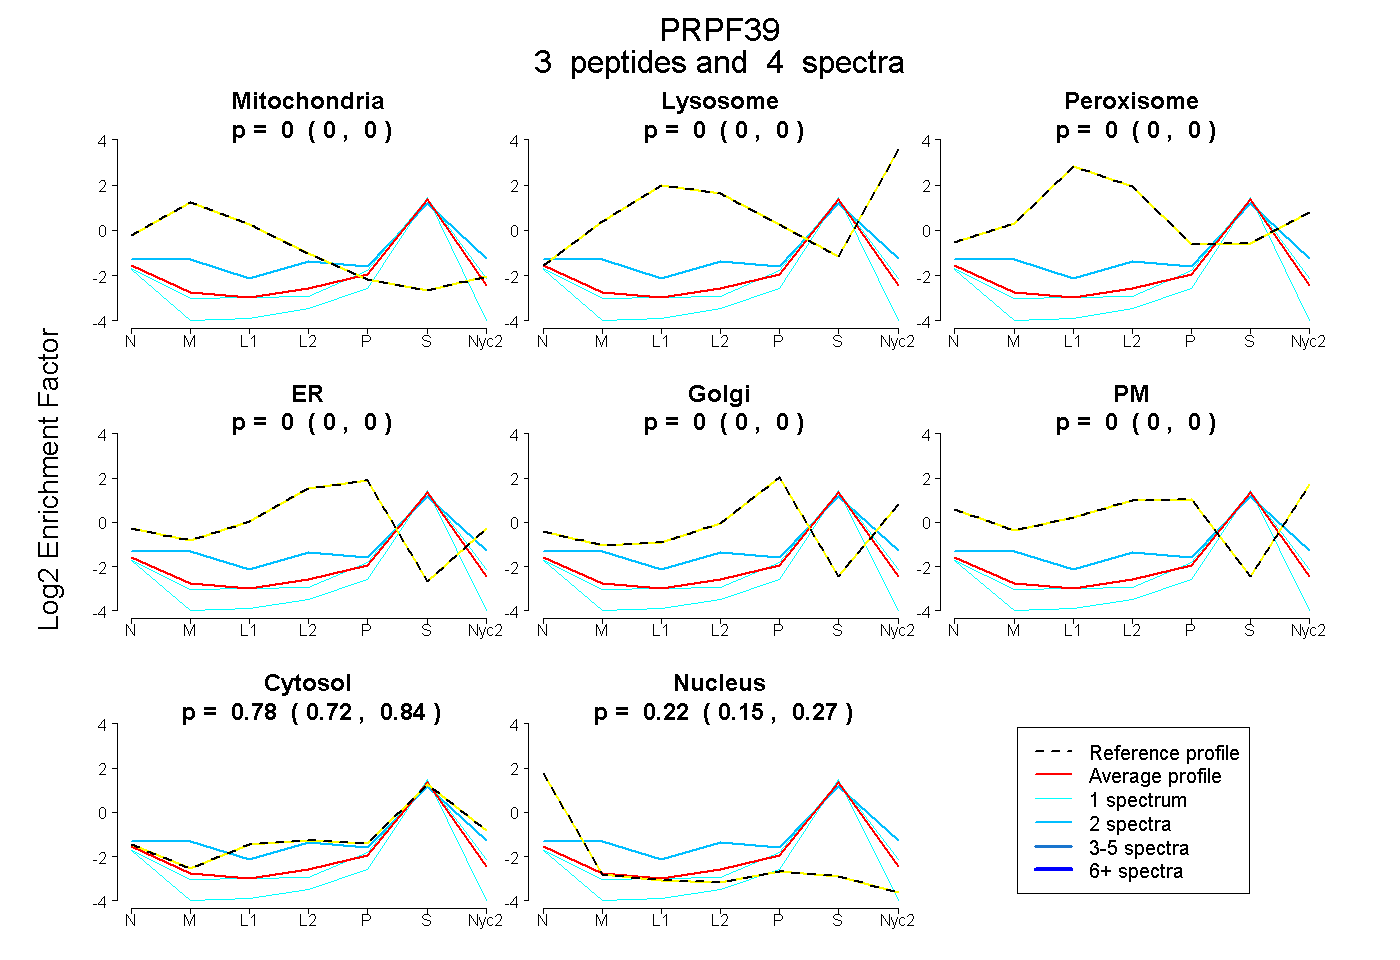
| Plot | Mito | Lyso | Perox | ER | Golgi | PM | Cytosol | Nucleus | |||||
| Expt A |
3 peptides |
4 spectra |
|
0.000 0.000 | 0.000 |
0.000 0.000 | 0.000 |
0.000 0.000 | 0.000 |
0.000 0.000 | 0.000 |
0.000 0.000 | 0.000 |
0.000 0.000 | 0.000 |
0.780 0.719 | 0.837 |
0.220 0.154 | 0.273 |
| 1 spectrum, LITEIENMR | 0.000 | 0.000 | 0.000 | 0.000 | 0.000 | 0.000 | 0.802 | 0.198 | ||
| 2 spectra, ITFSQR | 0.117 | 0.000 | 0.000 | 0.000 | 0.000 | 0.000 | 0.865 | 0.018 | ||
| 1 spectrum, ETLDPGDPETNSTIR | 0.000 | 0.000 | 0.000 | 0.000 | 0.000 | 0.000 | 0.603 | 0.397 |
| Plot | Mito | Lyso or Perox | ER | Golgi | PM | Cytosol | Nucleus | ||||||
| Expt B |
1 peptide |
1 spectrum |
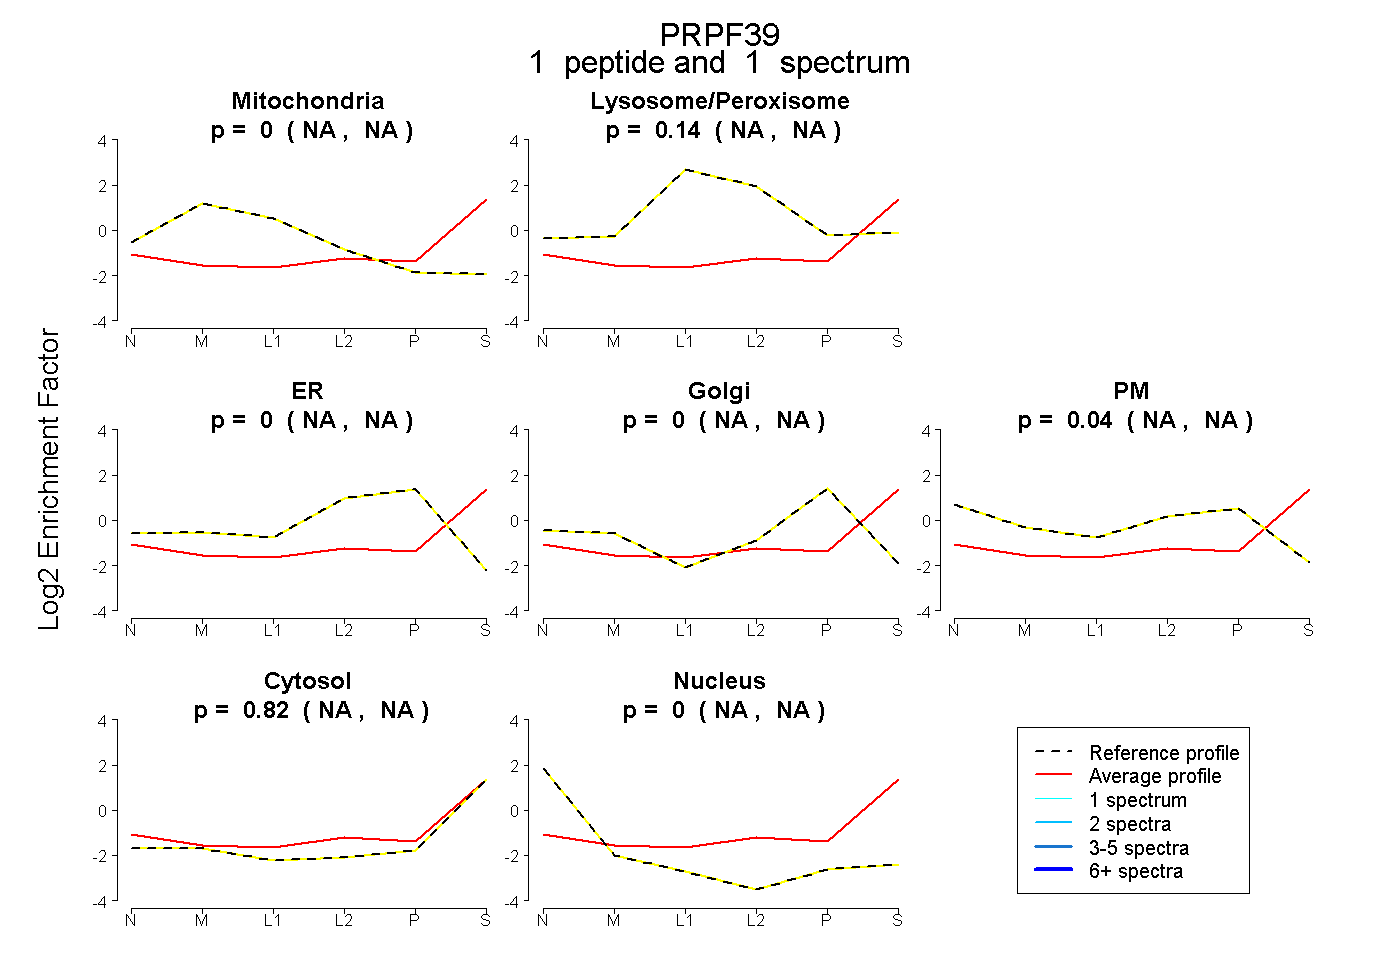 |
0.000 NA | NA |
0.138 NA | NA |
0.000 NA | NA |
0.000 NA | NA |
0.042 NA | NA |
0.820 NA | NA |
0.000 NA | NA |