 11
11peptides
spectra
0.000 | 0.005
0.000 | 0.000
0.000 | 0.000
0.757 | 0.783
0.148 | 0.173
0.000 | 0.000
0.000 | 0.003
0.061 | 0.068
| Plot | Mito | Lyso | Perox | ER | Golgi | PM | Cytosol | Nucleus | |||||
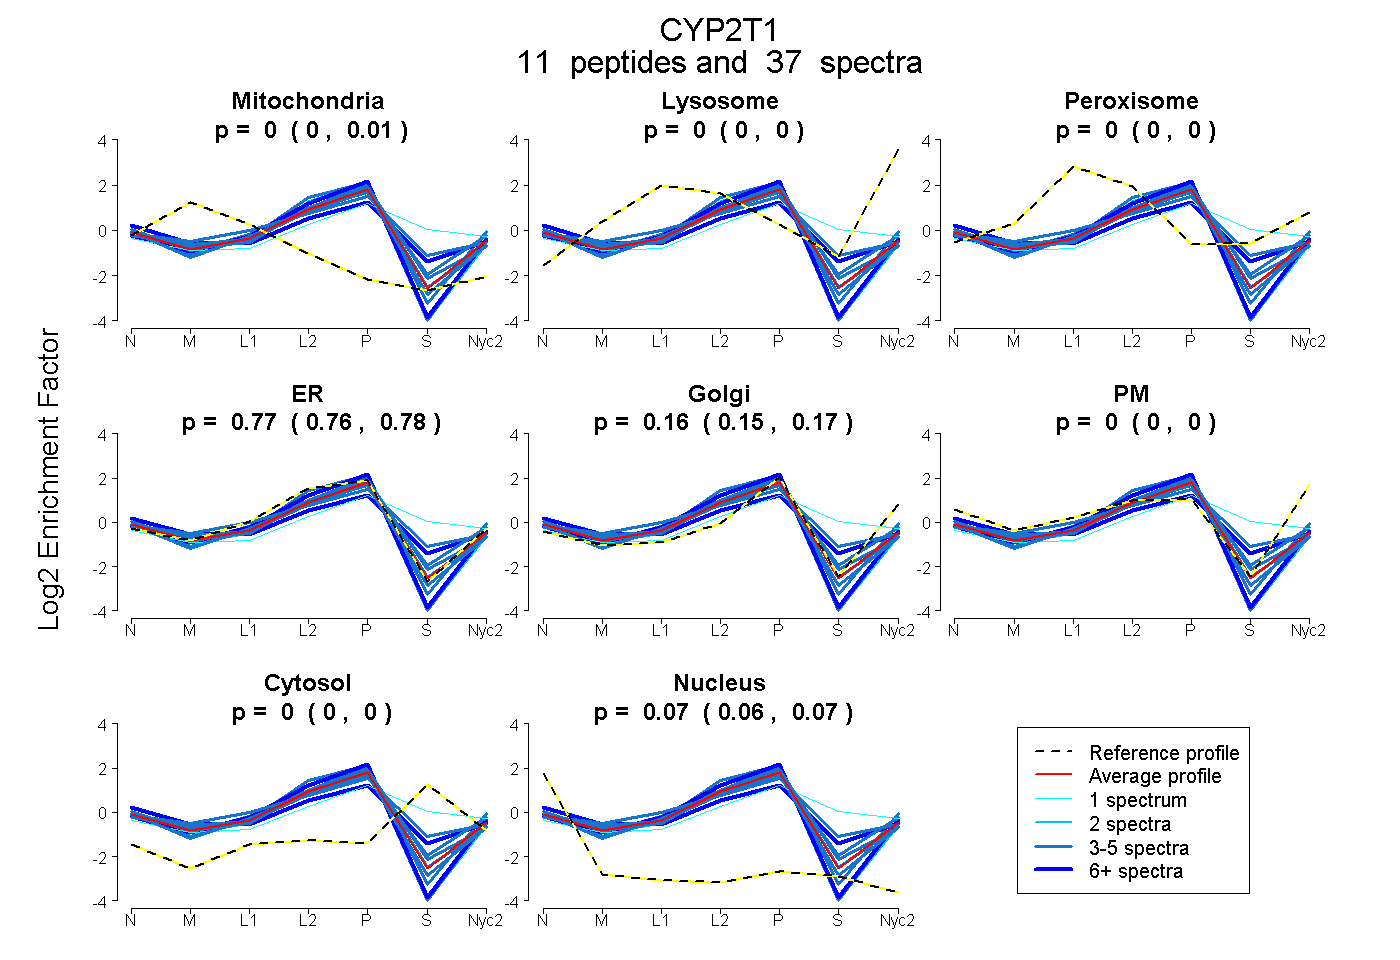
| Expt A |
11 peptides |
37 spectra |
|
0.000 0.000 | 0.005 |
0.000 0.000 | 0.000 |
0.000 0.000 | 0.000 |
0.772 0.757 | 0.783 |
0.161 0.148 | 0.173 |
0.000 0.000 | 0.000 |
0.000 0.000 | 0.003 |
0.066 0.061 | 0.068 |
| 4 spectra, LLDLFSDNFR | 0.000 | 0.000 | 0.000 | 0.963 | 0.000 | 0.000 | 0.000 | 0.037 | ||
| 1 spectrum, YGLLIMLK | 0.000 | 0.000 | 0.071 | 0.306 | 0.232 | 0.000 | 0.391 | 0.000 | ||
| 3 spectra, VQEELDATVGR | 0.000 | 0.000 | 0.000 | 0.691 | 0.119 | 0.073 | 0.095 | 0.022 | ||
| 3 spectra, VLMELSSR | 0.050 | 0.000 | 0.000 | 0.760 | 0.128 | 0.000 | 0.000 | 0.063 | ||
| 3 spectra, YPEVAAK | 0.011 | 0.000 | 0.100 | 0.645 | 0.054 | 0.000 | 0.189 | 0.000 | ||
| 6 spectra, MCLGAGLAR | 0.000 | 0.000 | 0.000 | 0.907 | 0.064 | 0.000 | 0.000 | 0.029 | ||
| 3 spectra, APSLADR | 0.000 | 0.000 | 0.000 | 0.735 | 0.247 | 0.000 | 0.000 | 0.017 | ||
| 6 spectra, LFISEQIQWHR | 0.057 | 0.000 | 0.000 | 0.543 | 0.081 | 0.110 | 0.178 | 0.031 | ||
| 3 spectra, YNYGDPEFLR | 0.000 | 0.000 | 0.000 | 0.780 | 0.103 | 0.000 | 0.062 | 0.056 | ||
| 2 spectra, DALVLQADAFSGR | 0.000 | 0.000 | 0.000 | 0.942 | 0.000 | 0.000 | 0.000 | 0.058 | ||
| 3 spectra, NHFLHK | 0.000 | 0.000 | 0.000 | 0.815 | 0.110 | 0.000 | 0.000 | 0.075 |
| Plot | Mito | Lyso or Perox | ER | Golgi | PM | Cytosol | Nucleus | ||||||
| Expt B |
7 peptides |
23 spectra |
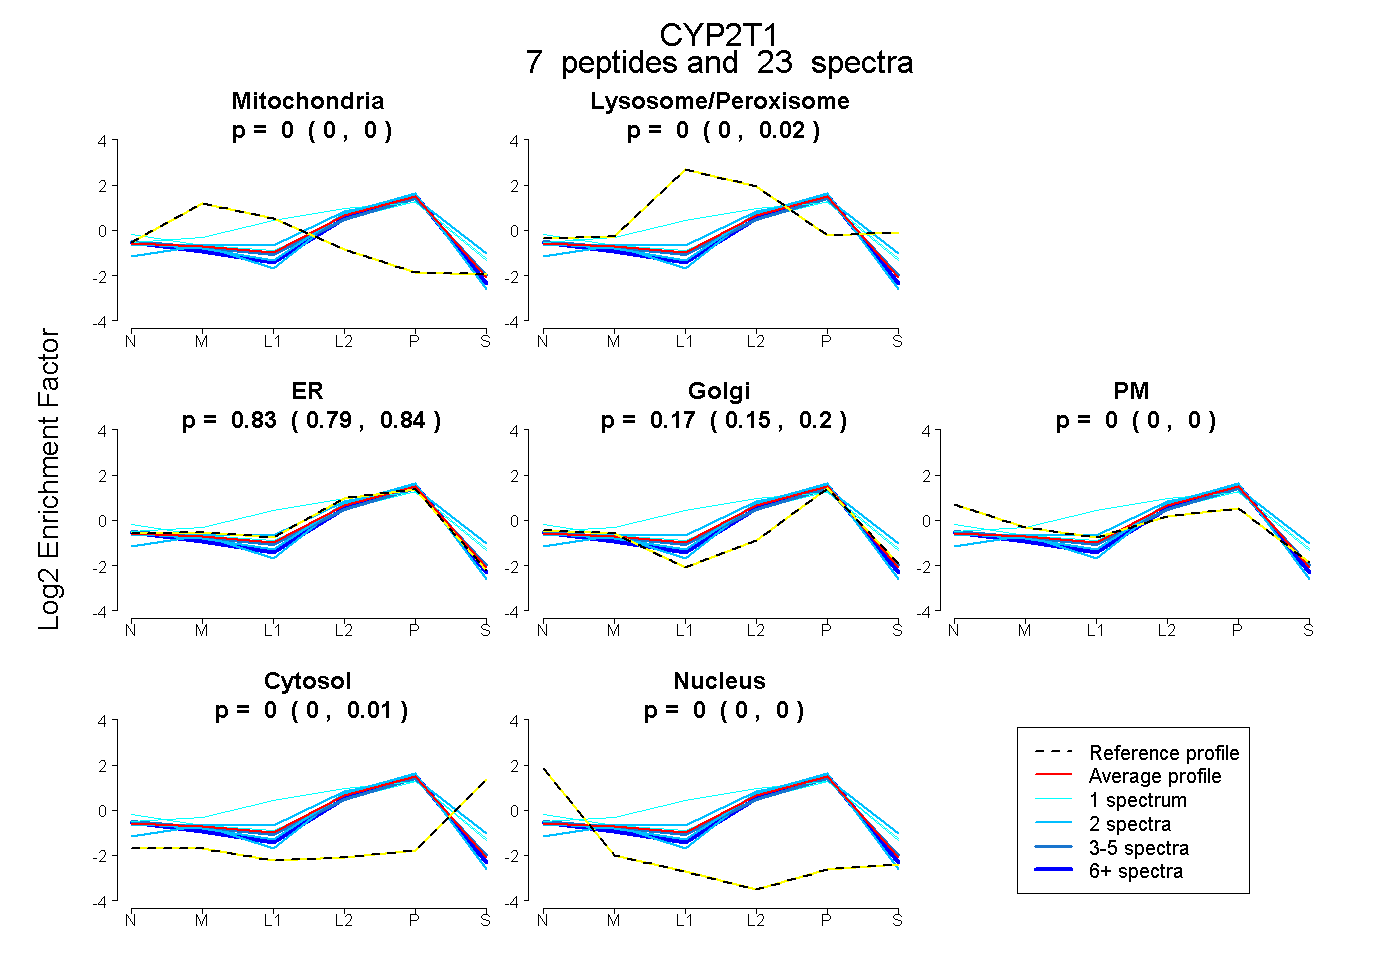 |
0.000 0.000 | 0.000 |
0.000 0.000 | 0.017 |
0.826 0.787 | 0.844 |
0.173 0.149 | 0.197 |
0.000 0.000 | 0.000 |
0.001 0.000 | 0.011 |
0.000 0.000 | 0.000 |
|||
| Plot | Lyso | Other | |||||||||||
| Expt C |
12 peptides |
47 spectra |
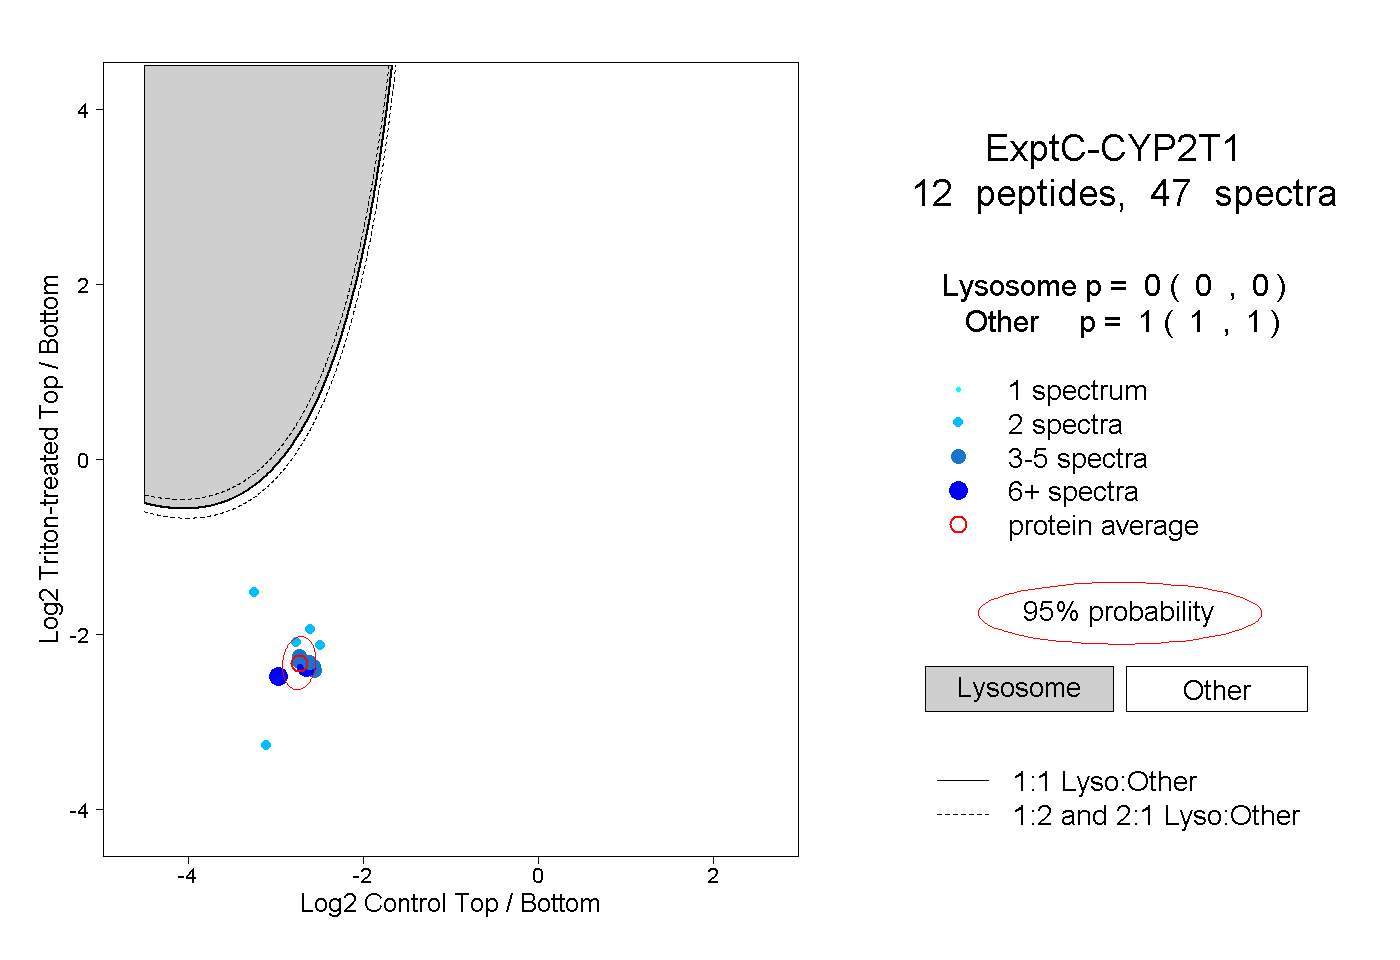 |
0.000 0.000 | 0.000 |
1.000 1.000 | 1.000 |
||||||||
| Plot | Lyso | Other | |||||||||||
| Expt D |
4 peptides |
8 spectra |
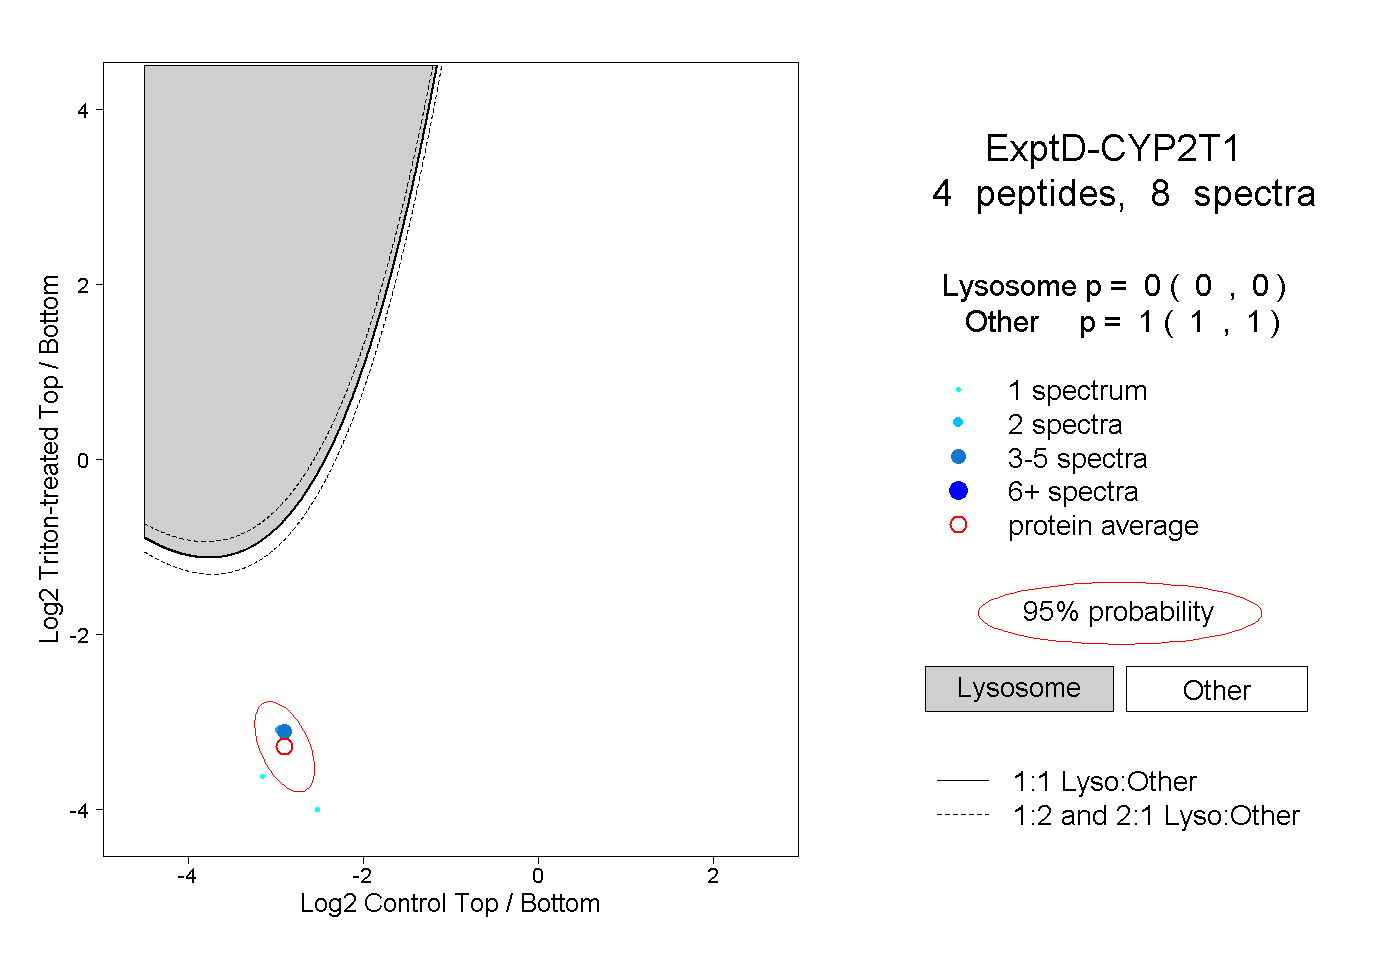 |
0.000 0.000 | 0.000 |
1.000 1.000 | 1.000 |