 19
19peptides
spectra
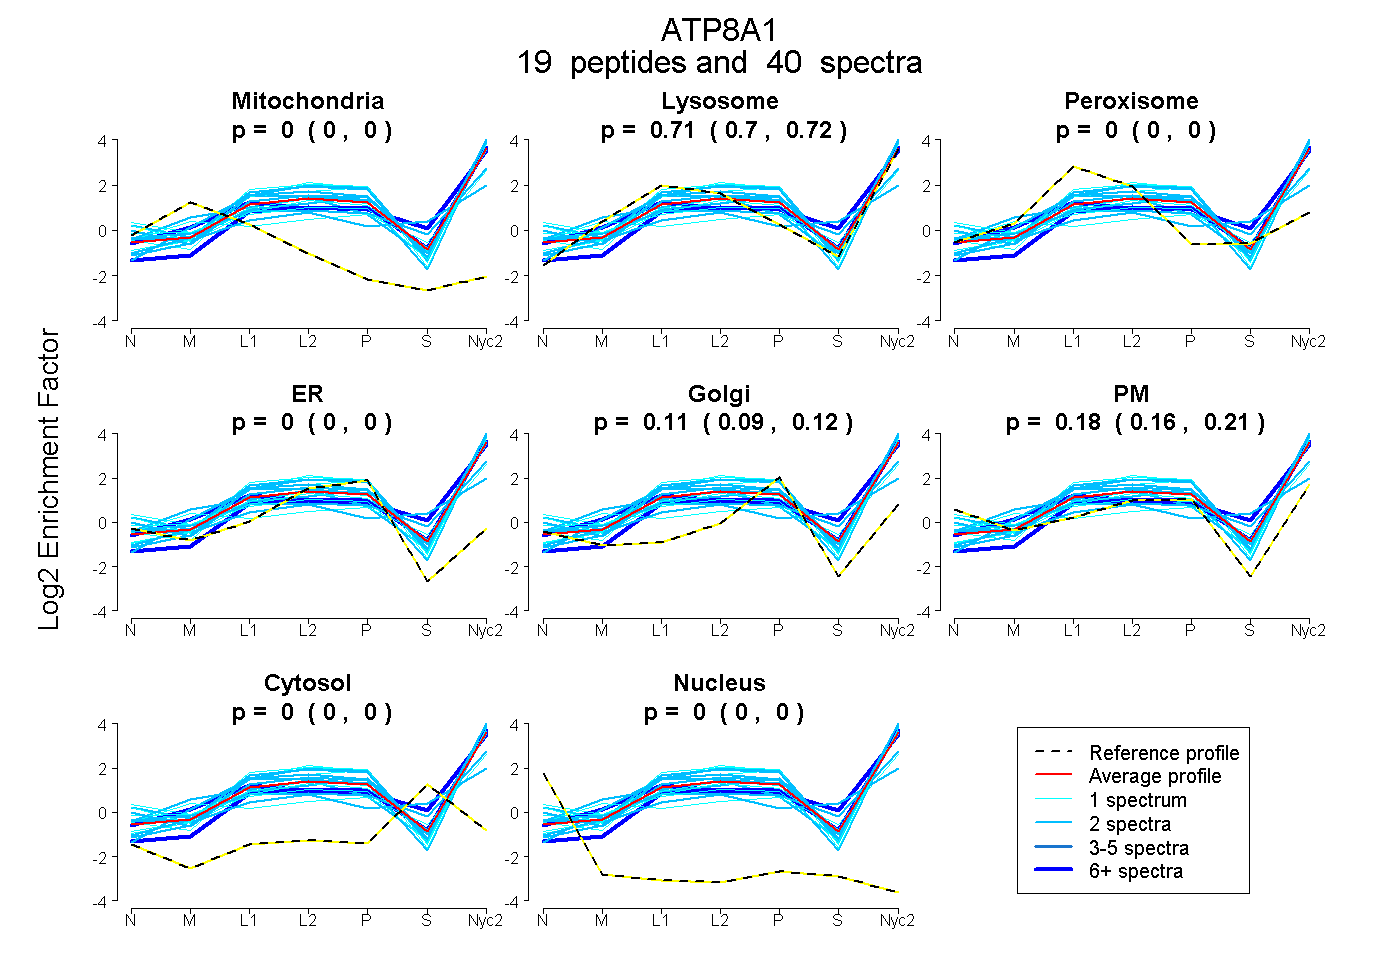
0.000 | 0.000
0.697 | 0.718
0.000 | 0.000
0.000 | 0.000
0.089 | 0.121
0.160 | 0.206
0.000 | 0.000
0.000 | 0.000
1peptide
spectrum
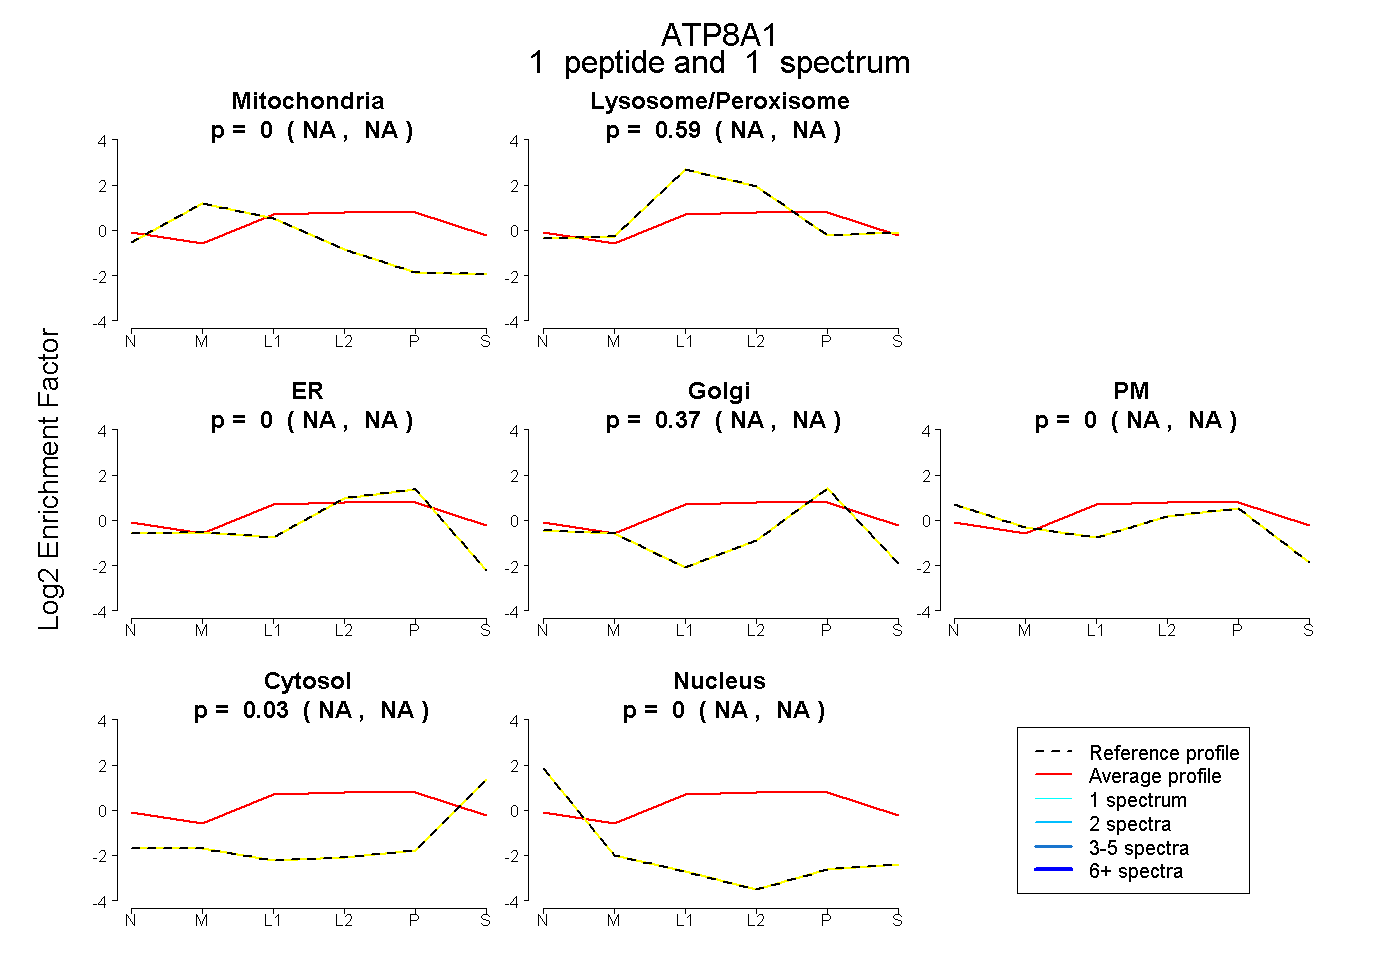
NA | NA
NA | NA
NA | NA
NA | NA
NA | NA
NA | NA
NA | NA
27peptides
spectra
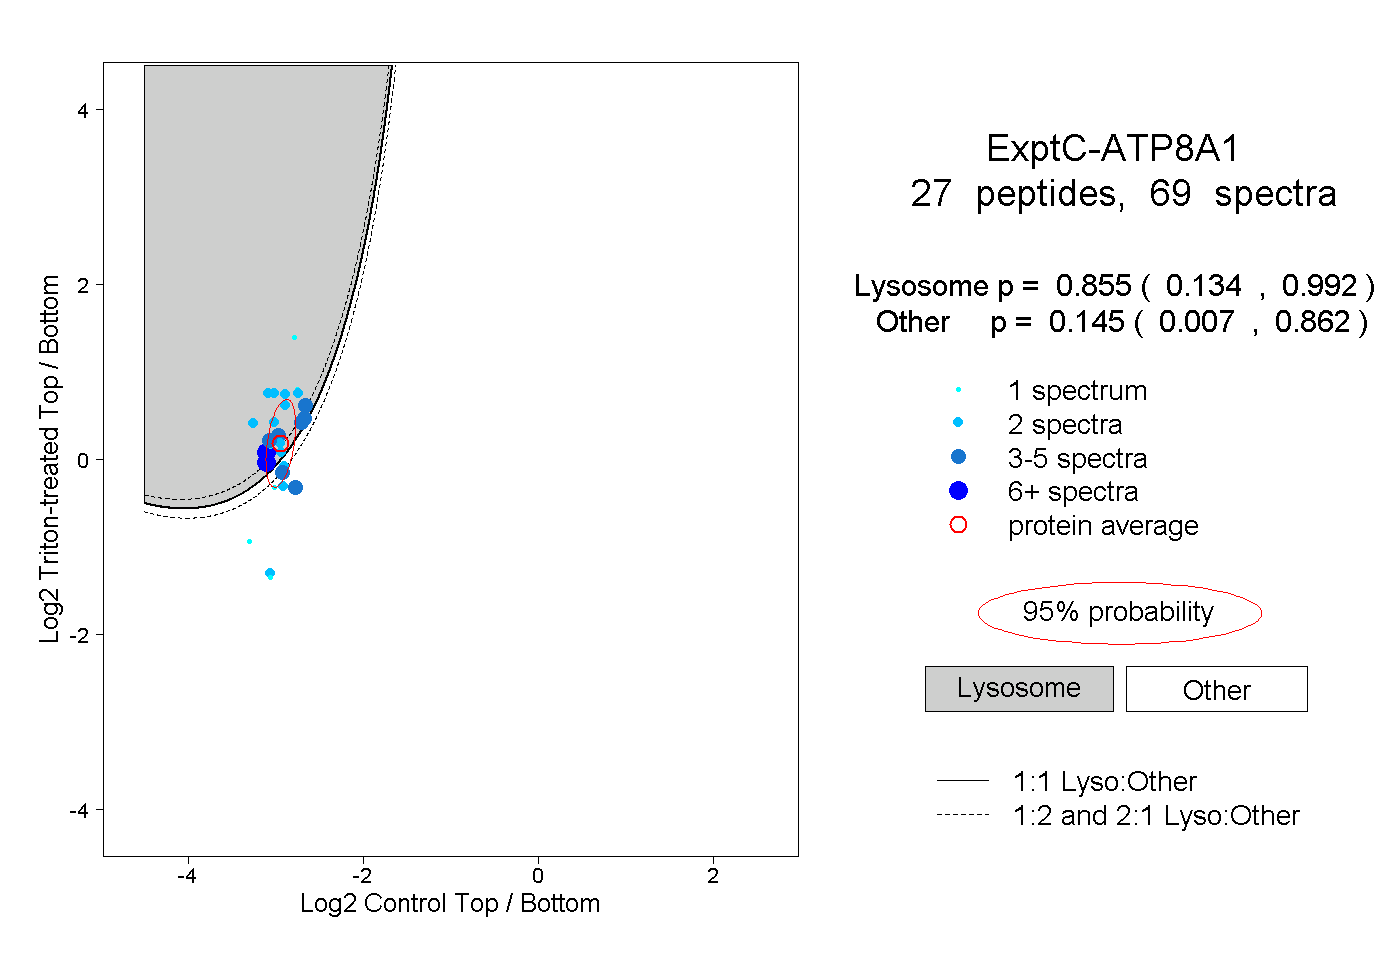
0.134 | 0.992
0.007 | 0.862
5peptides
spectra
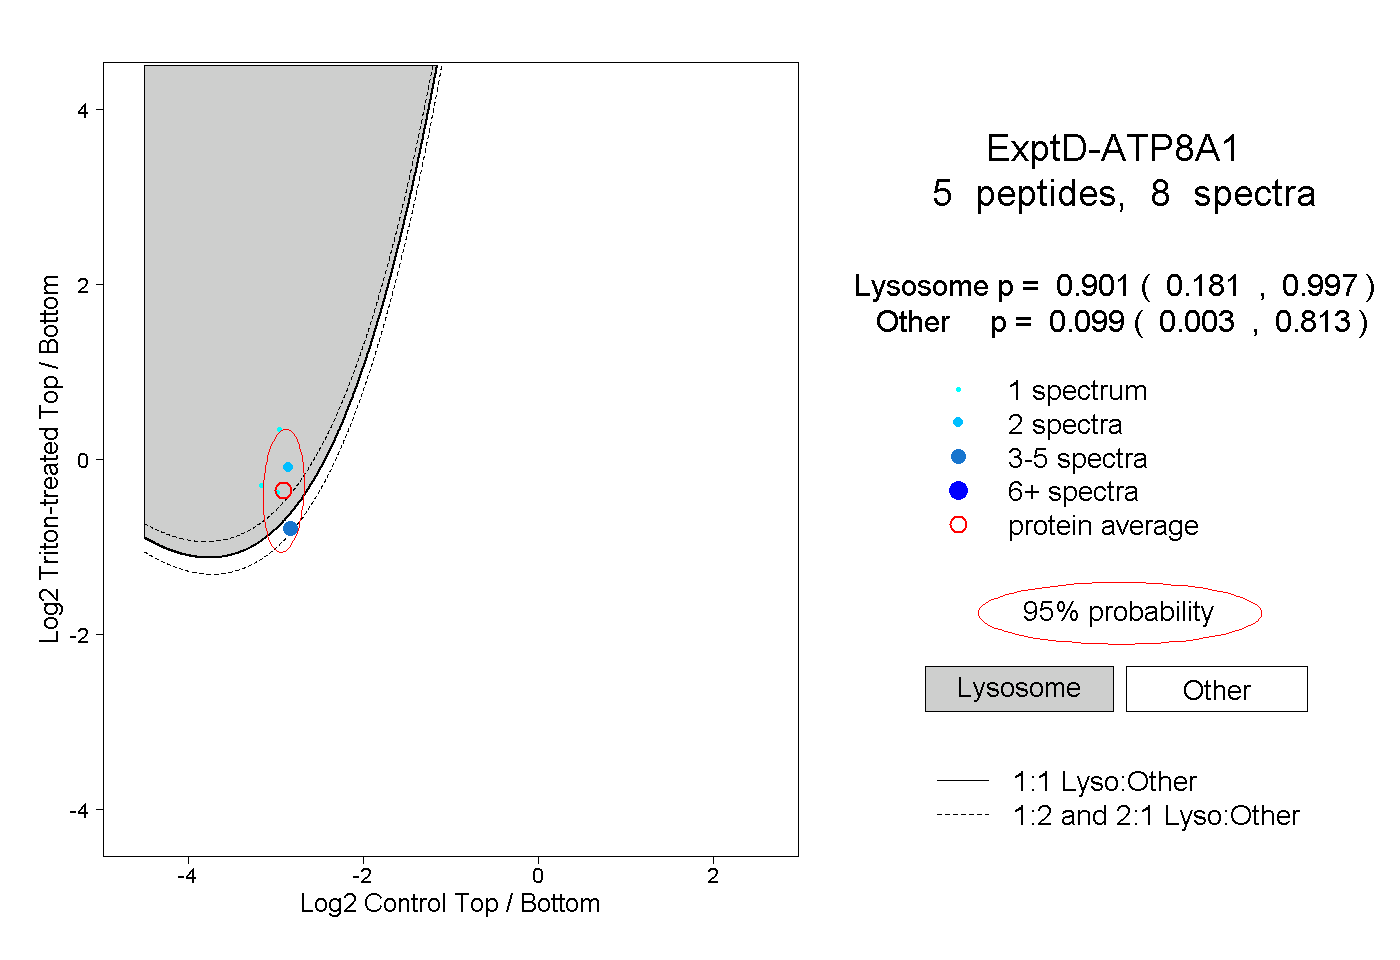
0.181 | 0.997
0.003 | 0.813