 2
2peptides
spectra
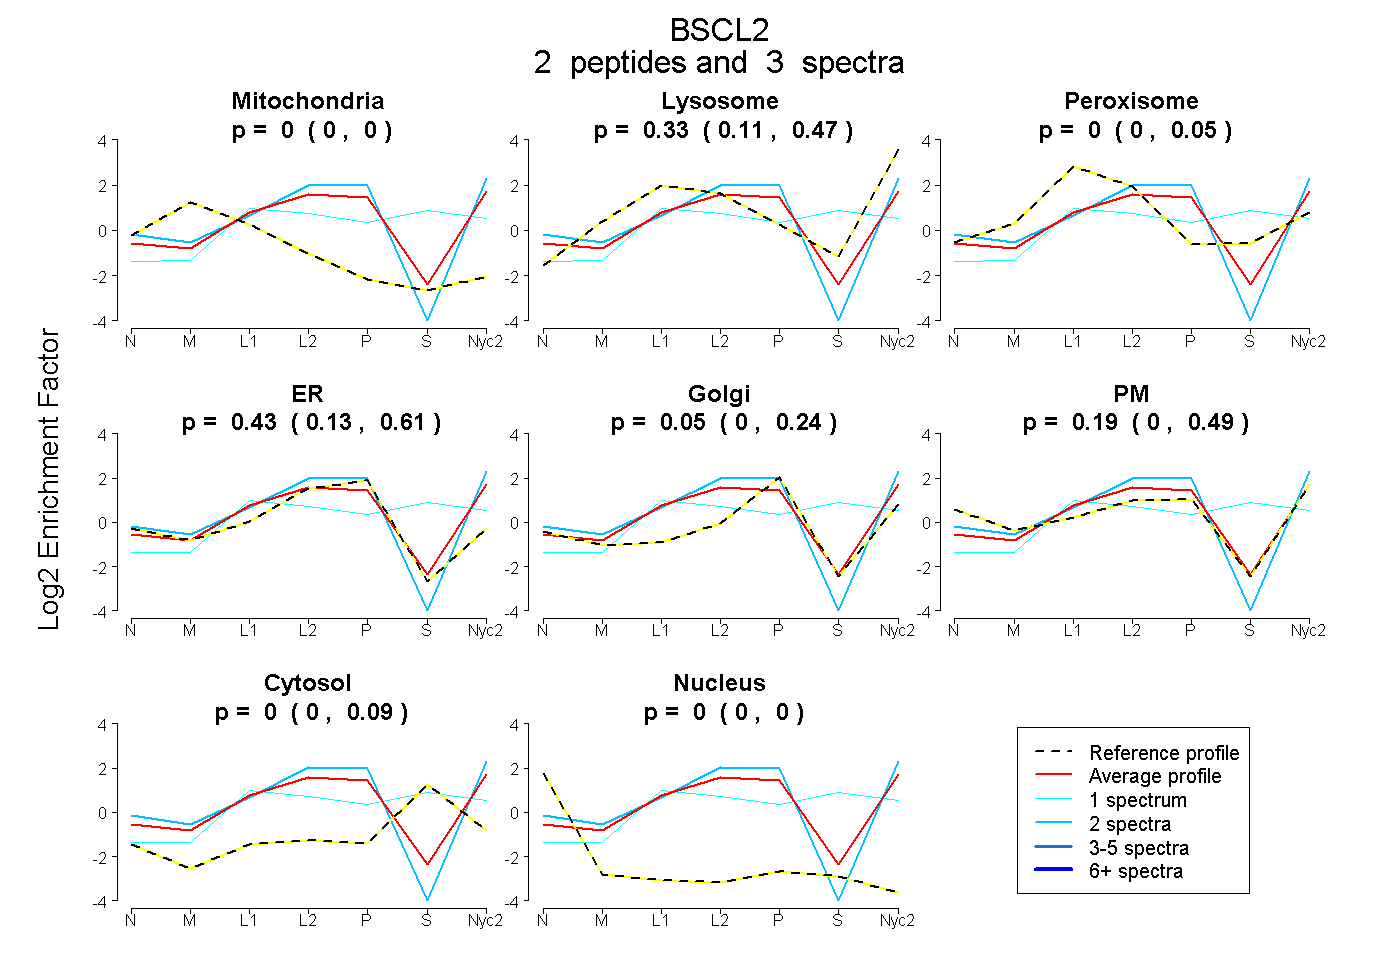
0.000 | 0.000
0.114 | 0.469
0.000 | 0.049
0.127 | 0.614
0.000 | 0.241
0.000 | 0.490
0.000 | 0.091
0.000 | 0.000
2peptides
spectra
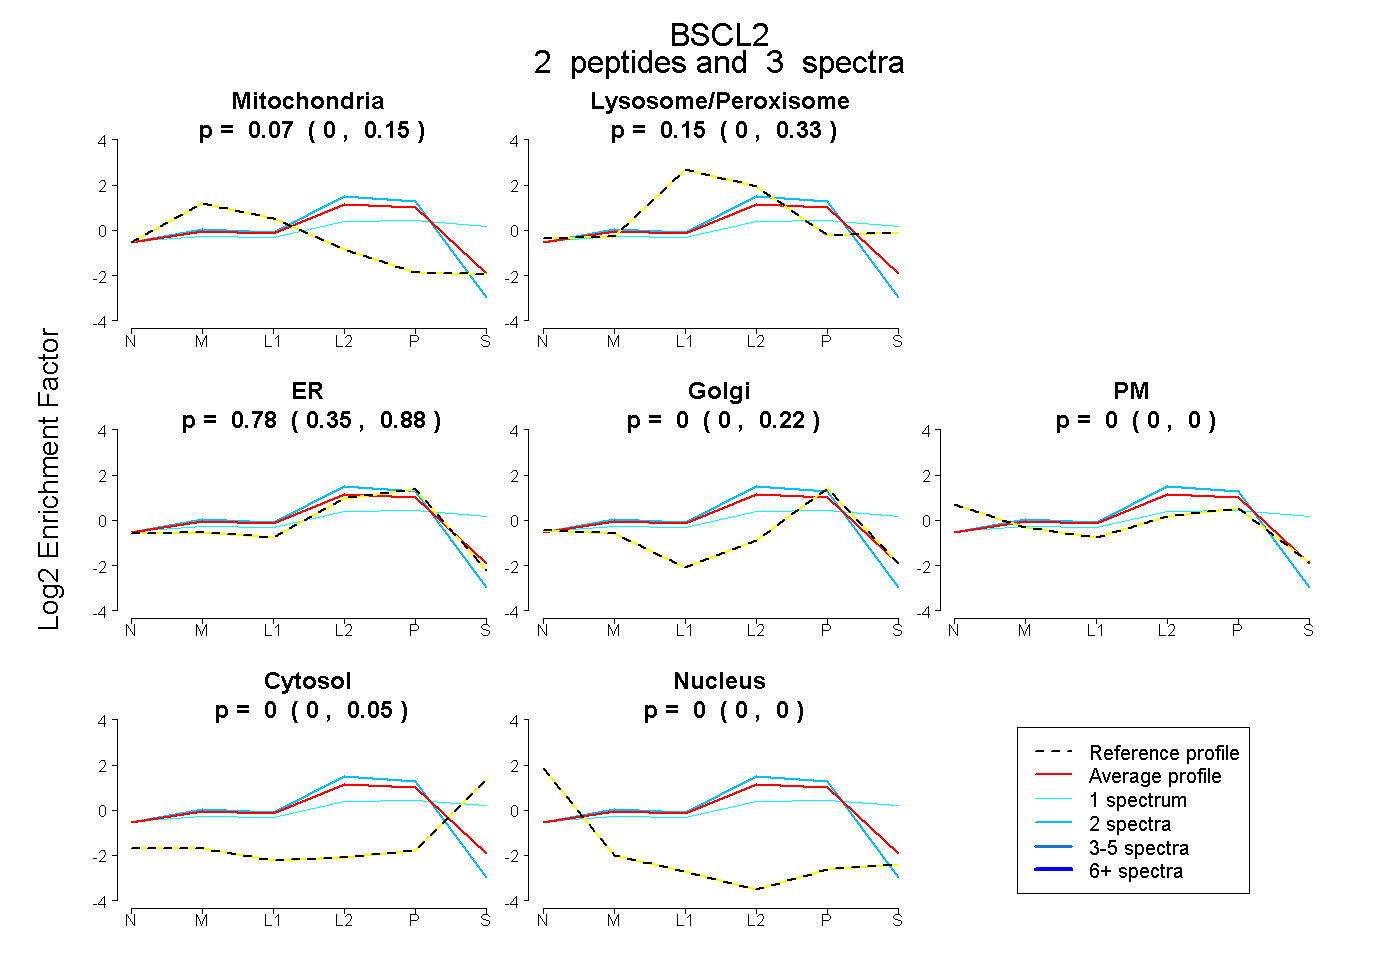
0.000 | 0.154
0.000 | 0.326
0.351 | 0.880
0.000 | 0.224
0.000 | 0.000
0.000 | 0.046
0.000 | 0.000
4peptides
spectra
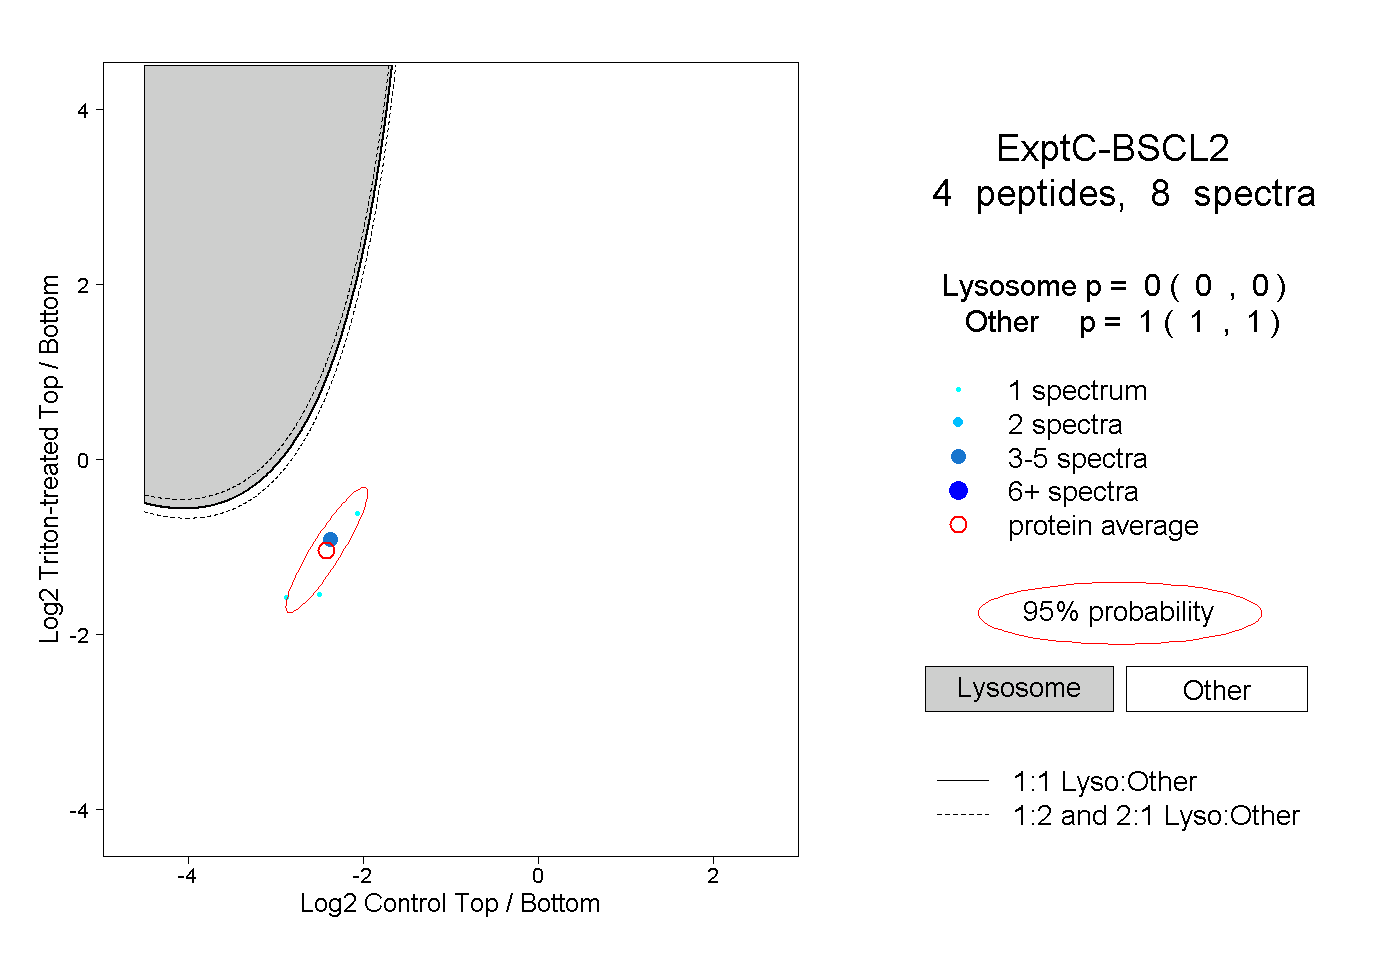
0.000 | 0.000
1.000 | 1.000
1peptide
spectra
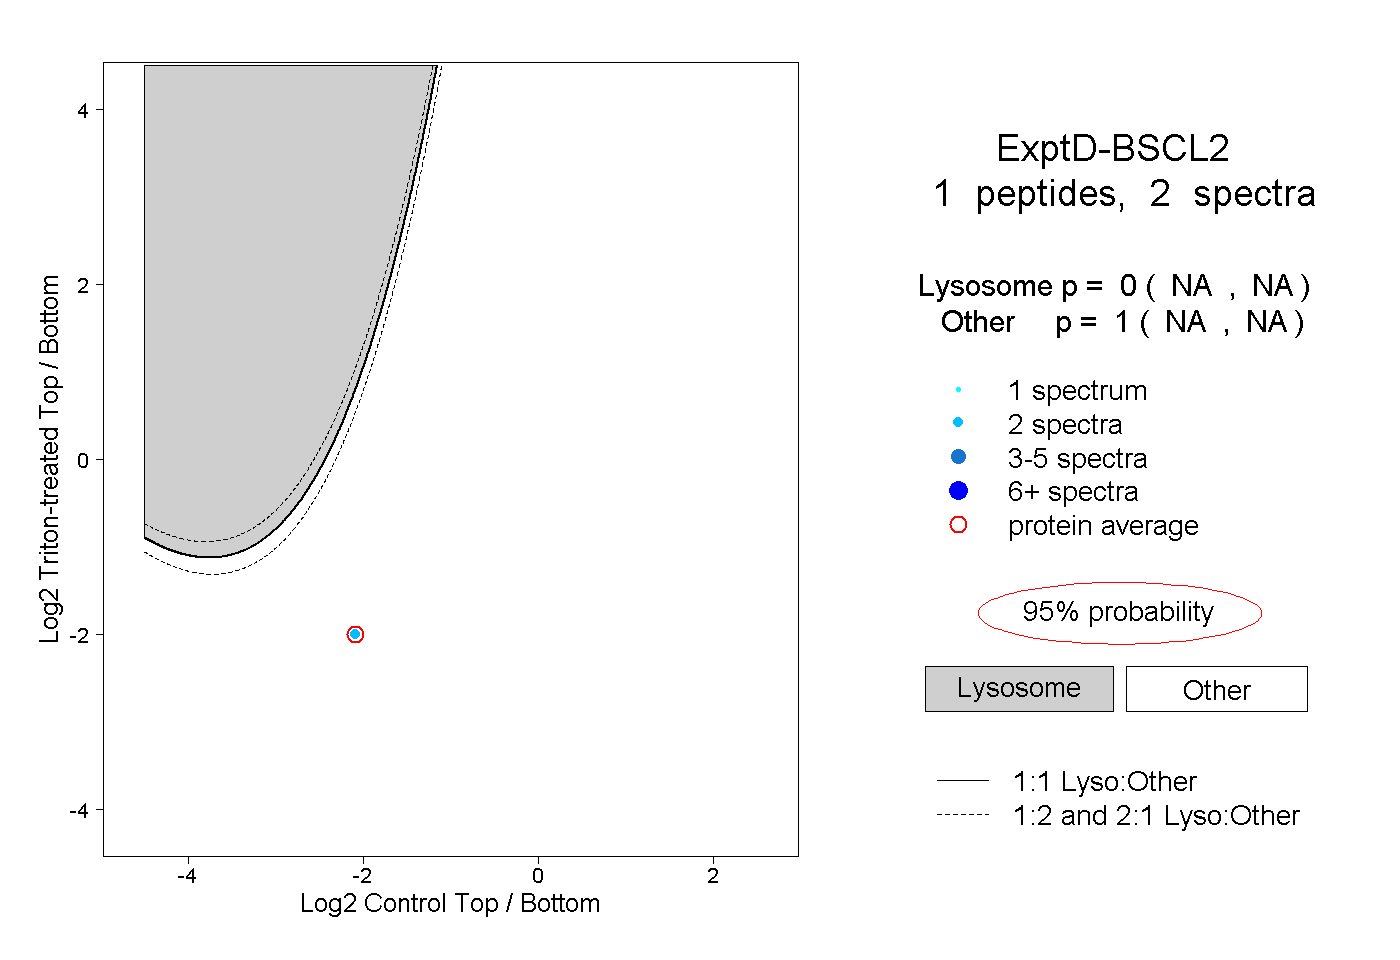
NA | NA
NA | NA