9
9peptides
spectra
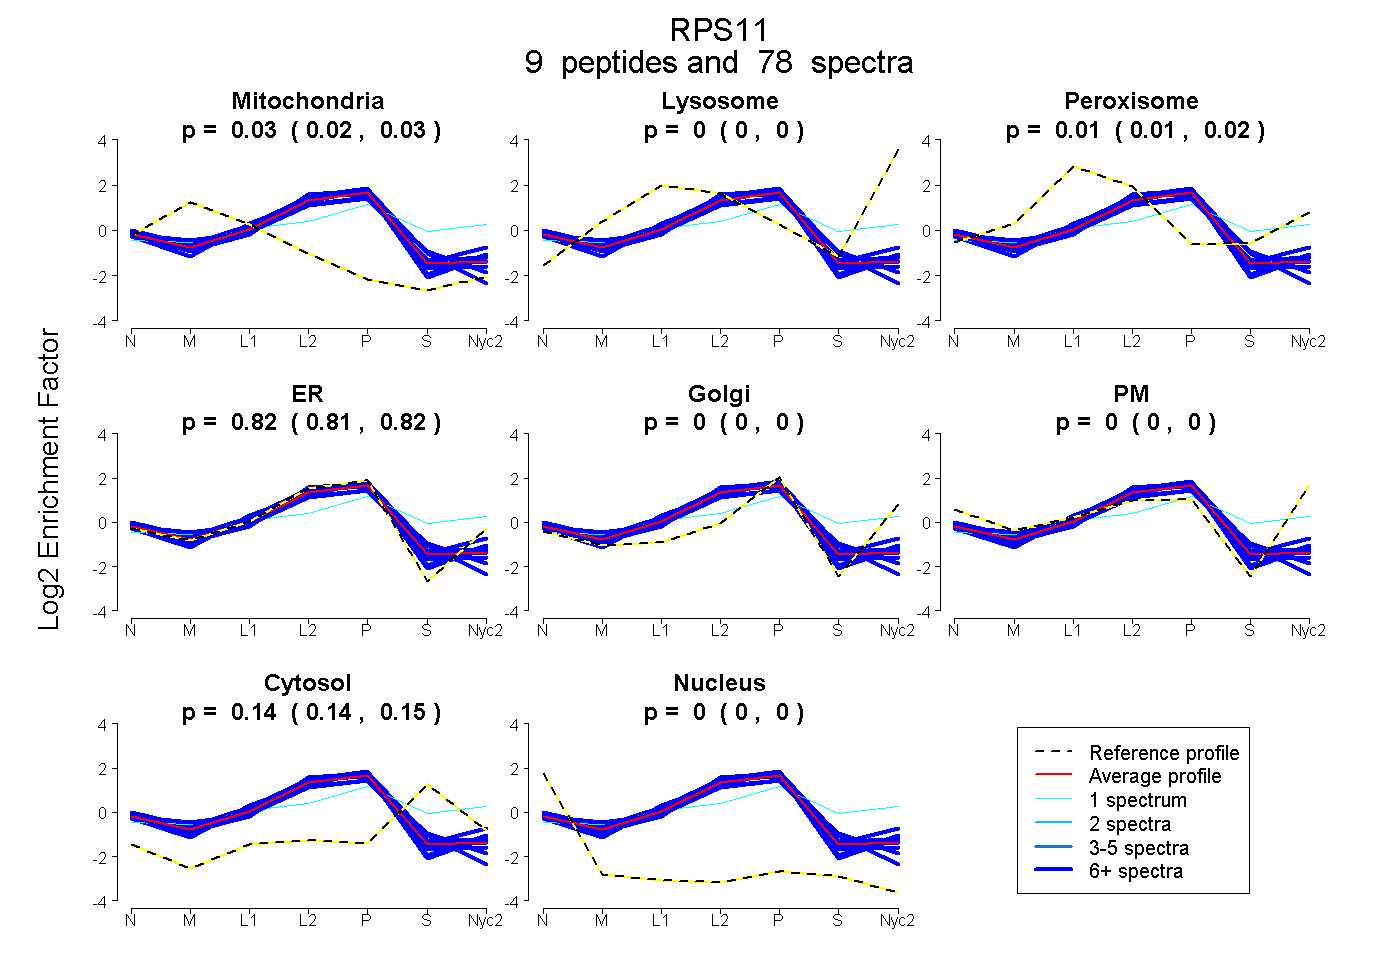
0.024 | 0.033
0.000 | 0.000
0.007 | 0.016
0.812 | 0.820
0.000 | 0.000
0.000 | 0.000
0.139 | 0.147
0.000 | 0.000
8peptides
spectra
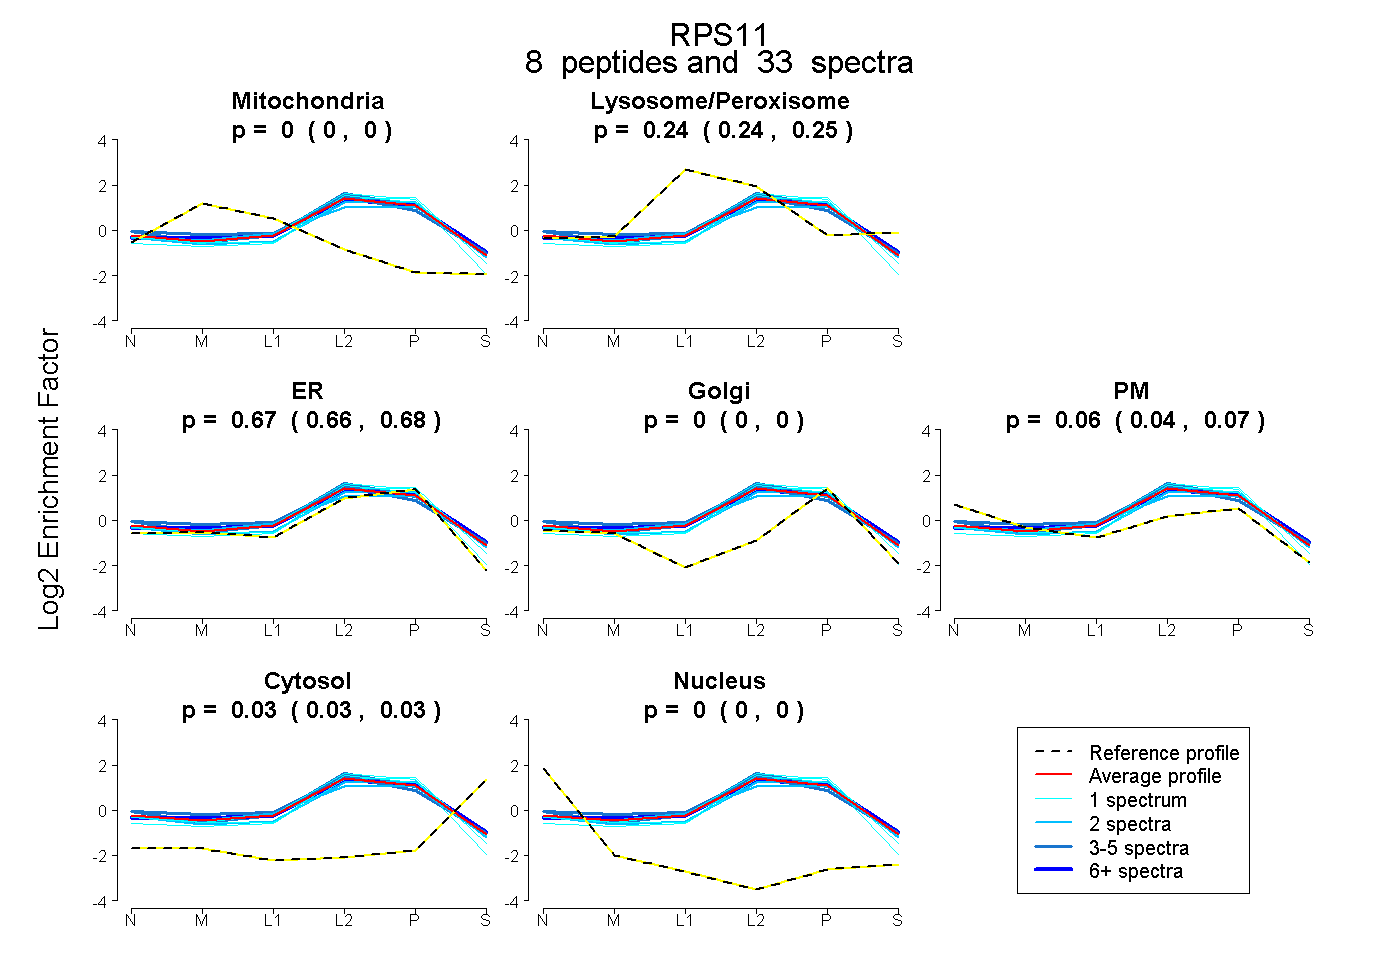
0.000 | 0.000
0.239 | 0.247
0.660 | 0.680
0.000 | 0.000
0.044 | 0.066
0.026 | 0.033
0.000 | 0.000
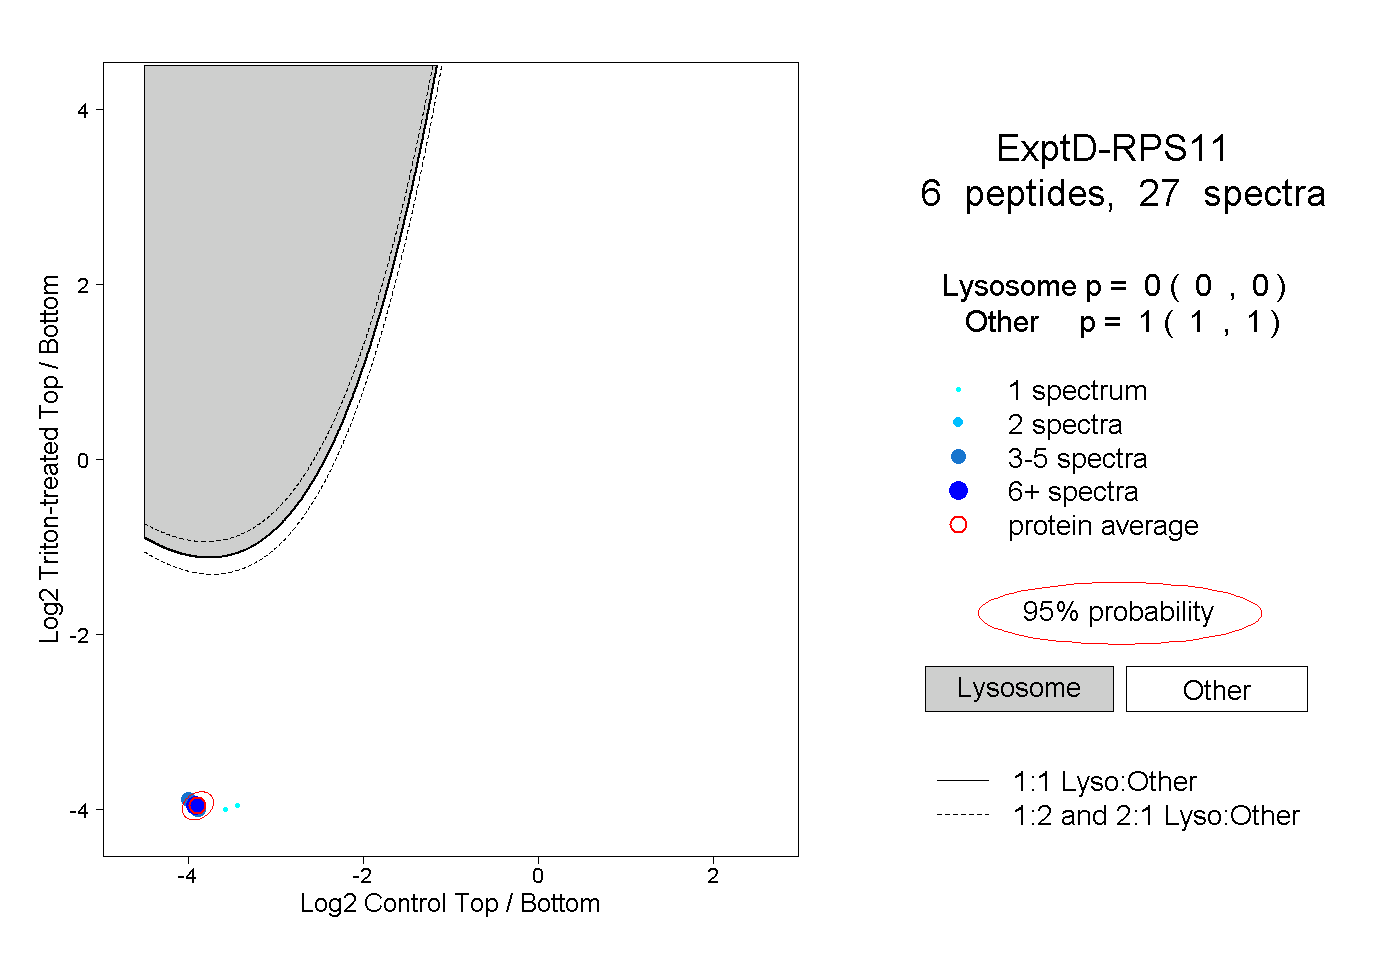
11peptides
spectra
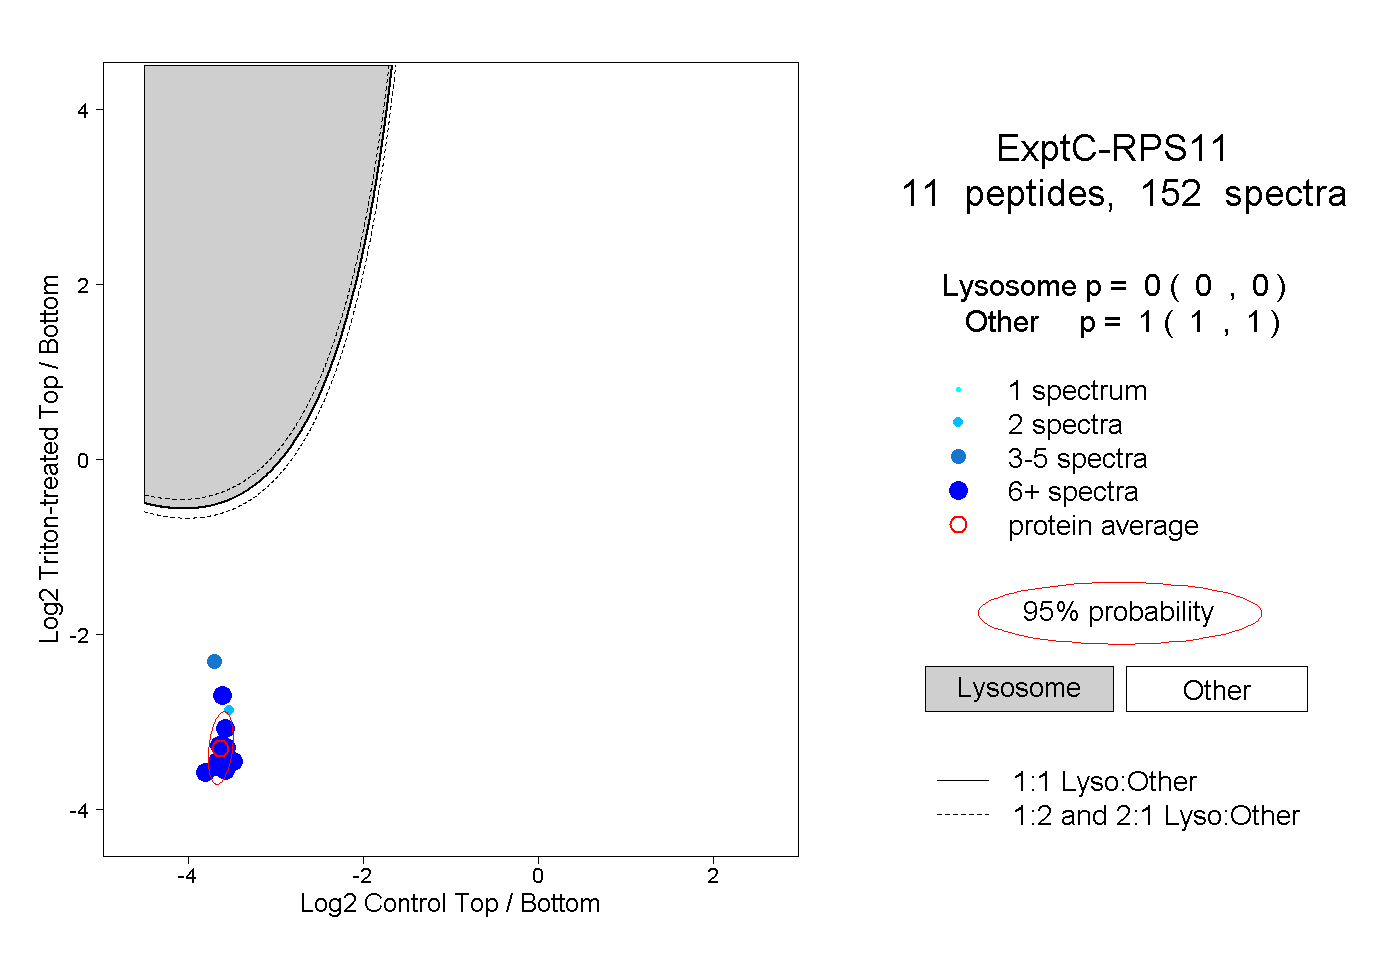
0.000 | 0.000
1.000 | 1.000