RPS11
[ENSRNOP00000061250]
Main page
| | | Plot |
Mito |
Lyso |
|
Perox |
ER |
Golgi |
PM |
Cytosol |
Nucleus |
|
| Expt A |
 9
9
peptides |
78
spectra |
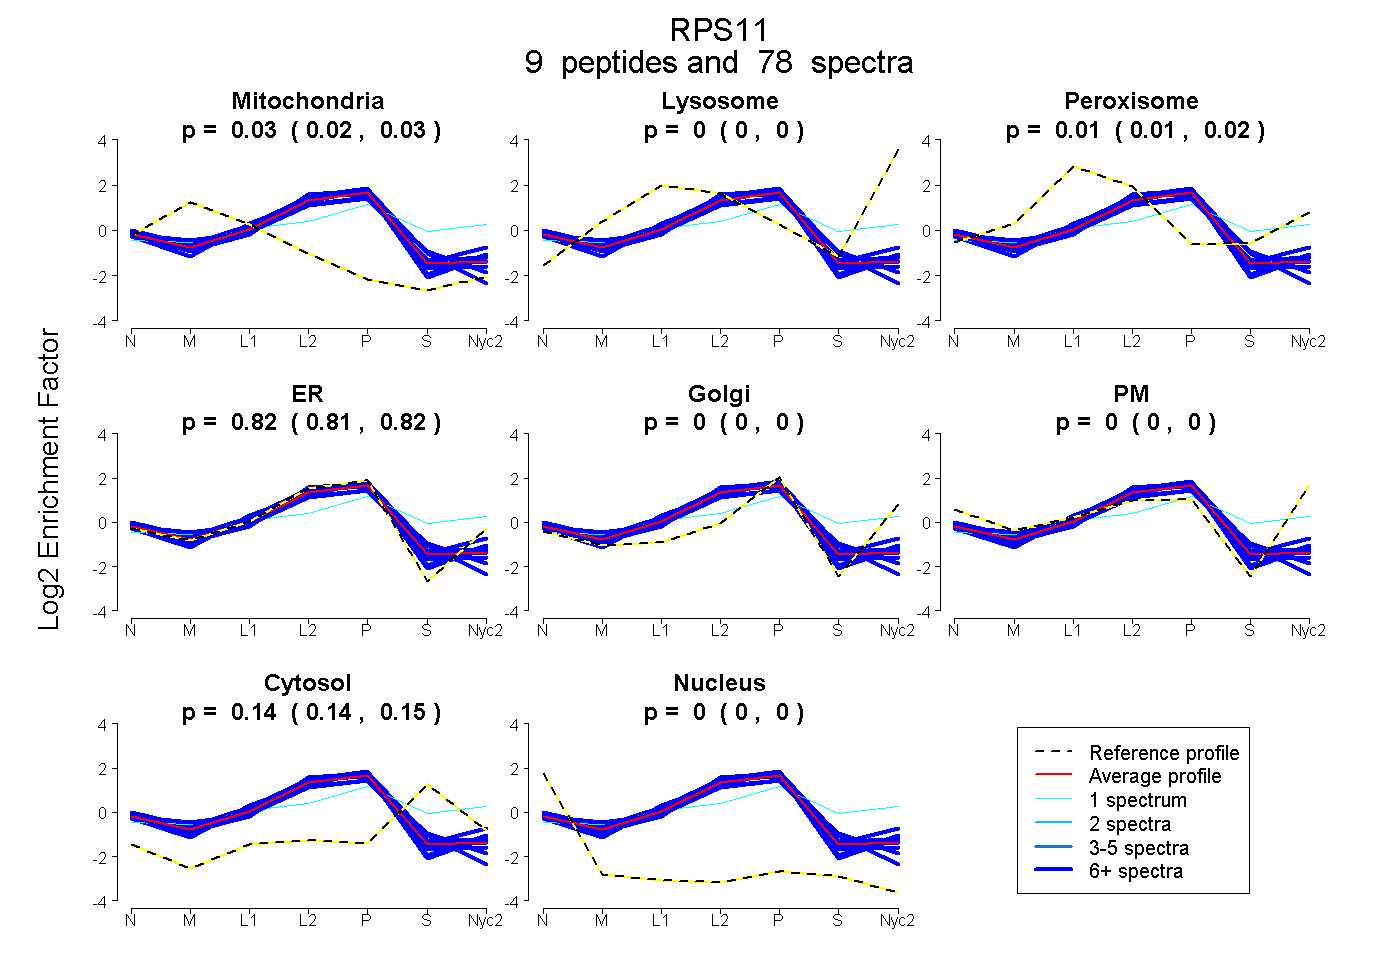 |
0.029
0.024 | 0.033 |
0.000
0.000 | 0.000 |
|
0.012
0.007 | 0.016 |
0.816
0.812 | 0.820 |
0.000
0.000 | 0.000 |
0.000
0.000 | 0.000 |
0.144
0.139 | 0.147 |
0.000
0.000 | 0.000 |
|
| | | Plot |
Mito |
|
Lyso or Perox |
|
ER |
Golgi |
PM |
Cytosol |
Nucleus |
|
| Expt B |
8
peptides |
33
spectra |
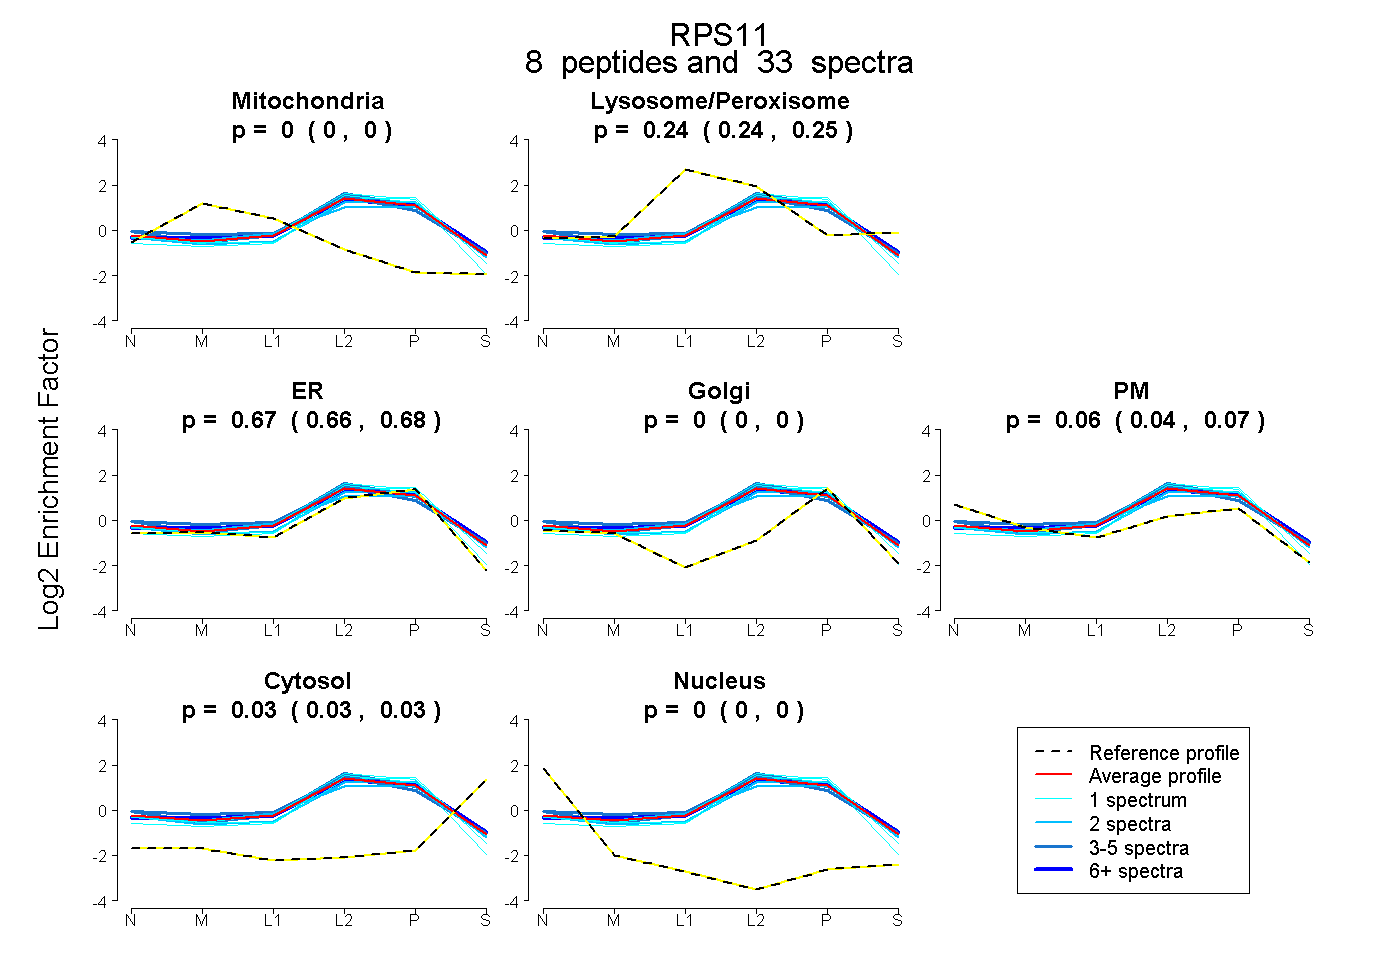 |
0.000
0.000 | 0.000 |
|
0.243
0.239 | 0.247 |
|
0.671
0.660 | 0.680 |
0.000
0.000 | 0.000 |
0.056
0.044 | 0.066 |
0.030
0.026 | 0.033 |
0.000
0.000 | 0.000 |
|
| 2 spectra, EAIEGTYIDK |
0.000 |
|
0.159 |
|
0.760 |
0.000 |
0.031 |
0.050 |
0.000 |
|
| 4 spectra, CPFTGNVSIR |
0.000 |
|
0.279 |
|
0.620 |
0.000 |
0.085 |
0.016 |
0.000 |
|
| 1 spectrum, VLLGETGK |
0.000 |
|
0.114 |
|
0.865 |
0.000 |
0.000 |
0.022 |
0.000 |
|
| 2 spectra, QPTIFQNK |
0.000 |
|
0.311 |
|
0.434 |
0.219 |
0.036 |
0.000 |
0.000 |
|
| 1 spectrum, TIVIR |
0.000 |
|
0.192 |
|
0.770 |
0.000 |
0.000 |
0.038 |
0.000 |
|
| 18 spectra, DYLHYIR |
0.000 |
|
0.255 |
|
0.659 |
0.005 |
0.036 |
0.044 |
0.000 |
|
| 4 spectra, ILSGVVTK |
0.000 |
|
0.293 |
|
0.495 |
0.000 |
0.206 |
0.005 |
0.000 |
|
| 1 spectrum, NIGLGFK |
0.000 |
|
0.165 |
|
0.835 |
0.000 |
0.000 |
0.000 |
0.000 |
|
| | | Plot |
|
Lyso |
|
|
|
|
|
|
|
Other |
| Expt C |
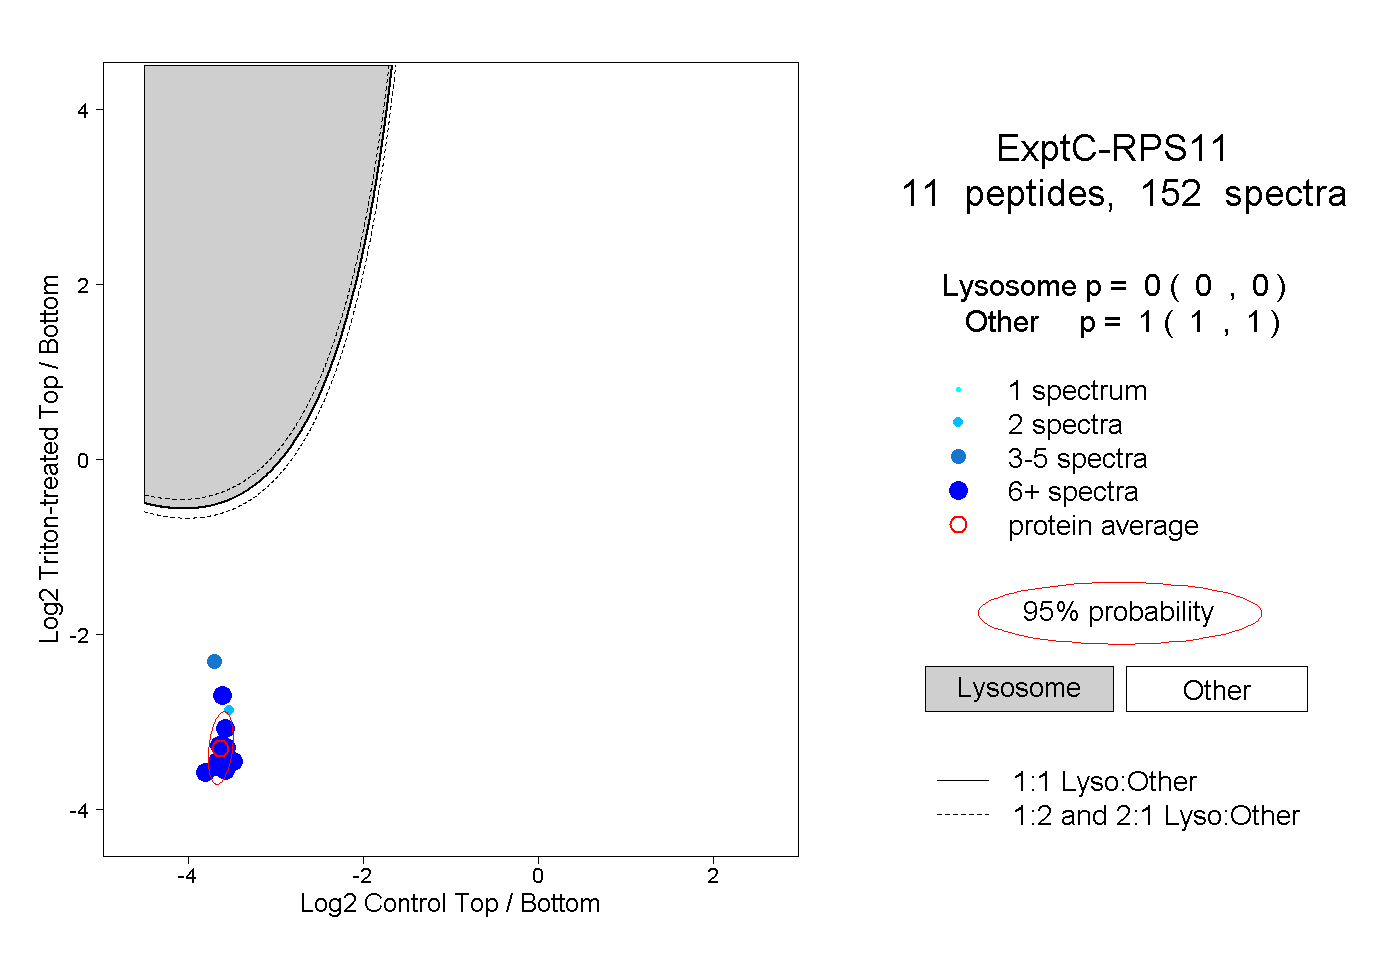
11
peptides |
152
spectra |
 |
|
0.000
0.000 | 0.000 |
|
|
|
|
|
|
|
1.000
1.000 | 1.000 |
| | | Plot |
|
Lyso |
|
|
|
|
|
|
|
Other |
| Expt D |
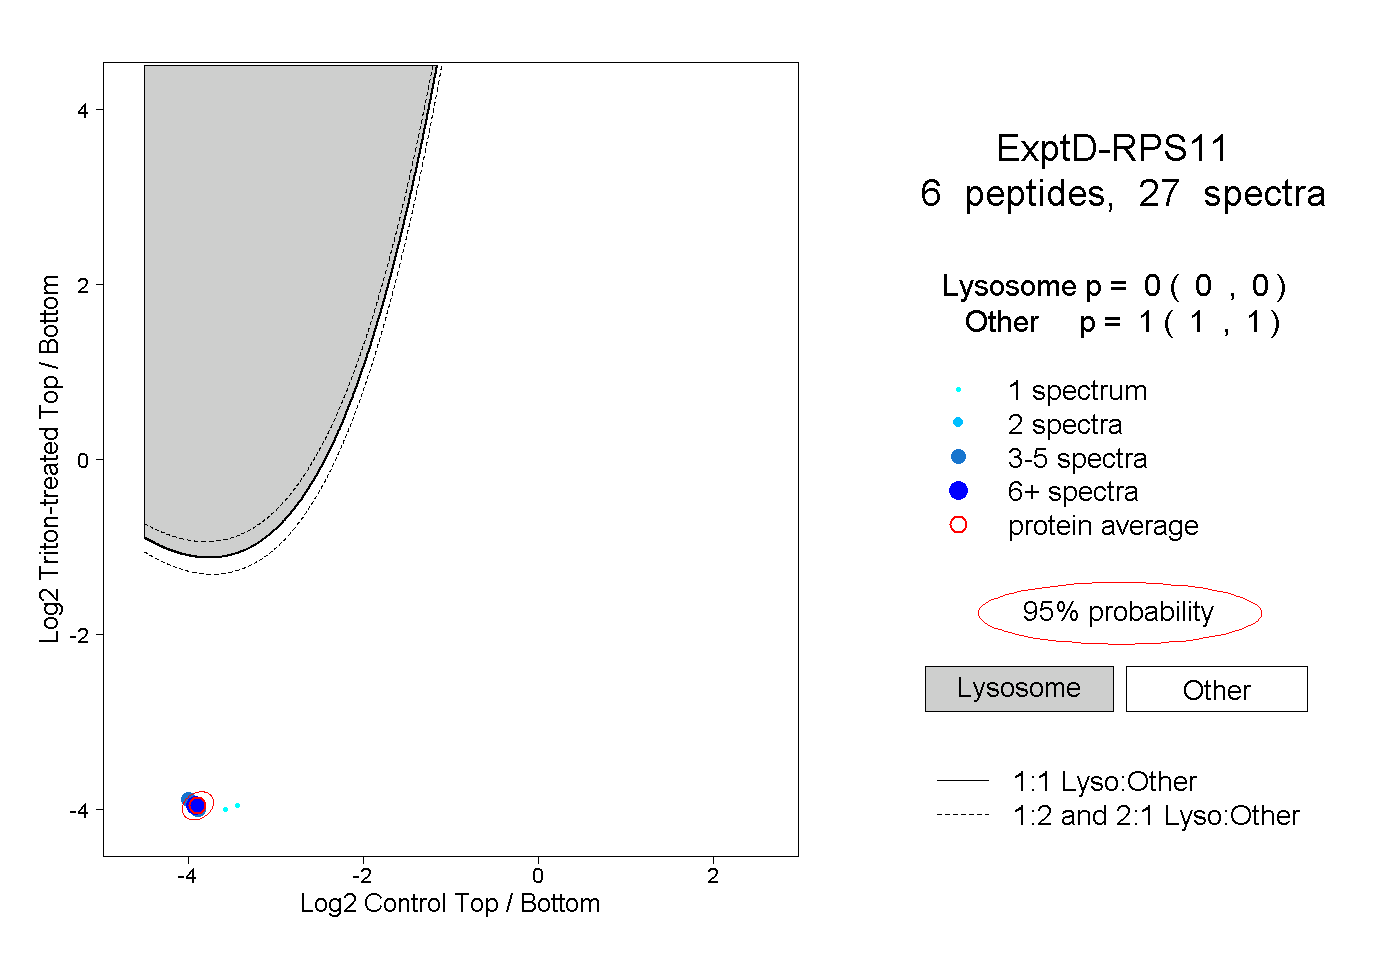
6
peptides |
27
spectra |
 |
|
0.000
0.000 | 0.000 |
|
|
|
|
|
|
|
1.000
1.000 | 1.000 |